Overview
Modern organizations thrive on data, yet its complexity poses challenges. Data observability is key. It ensures data accuracy, availability, and usability by collecting insights and proactively identifying issues. This boosts confidence, minimizes risks, and enhances collaboration, ultimately fostering innovation and agility.
With Blindata Data Observability features you can:
- gain insights on the shape of your data assets by sharing data profiling information within the data catalog
- automate anomaly detection processes by speeding up common data ops and quality checks that usually are neglected
- lower the risk of troubles by taking a proactive approach to data monitoring automatically track issues and incidents for performance monitoring over time
Features
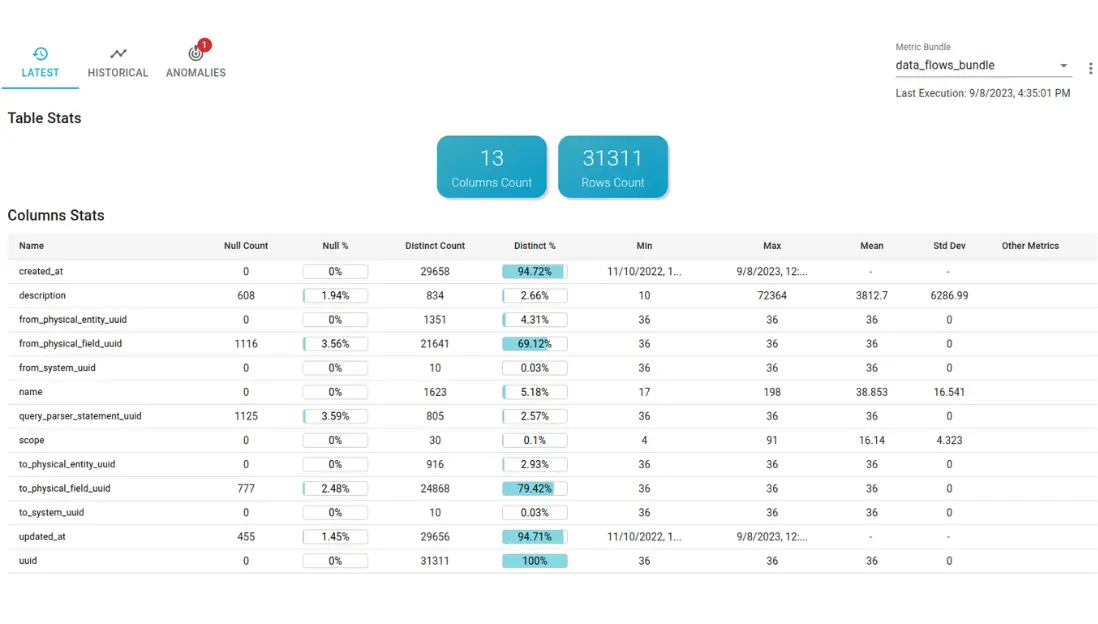
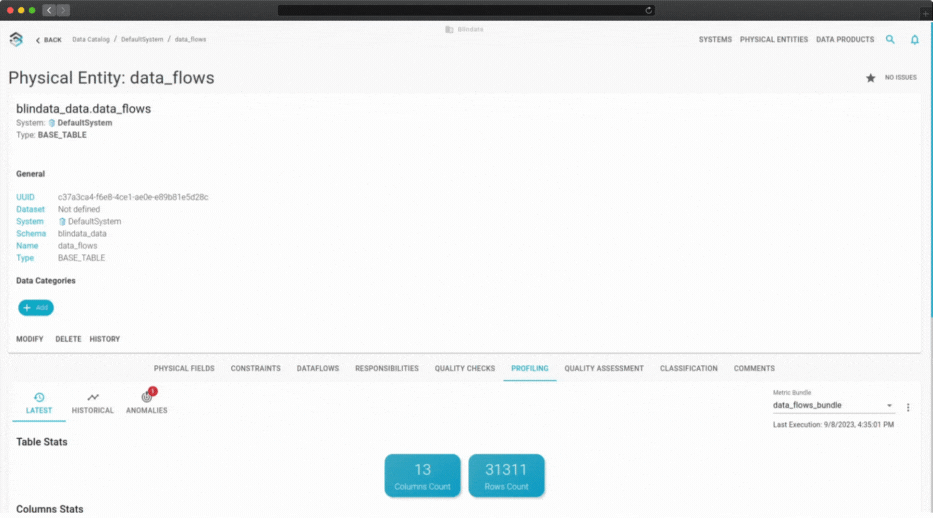
Profiling
Automate metrics collection from your data assets. Insights integrate seamlessly into our collaborative data catalog, enabling easy access and sharing among your team.
Auto ML
Automatically train the right machine learning model according to the specific use case and metrics, relieving you of the intricacies of manual model selection and configuration.
Anomaly detection
Revolutionize your data operations with automated anomaly detection. Don’t let common data pitfalls go unnoticed.
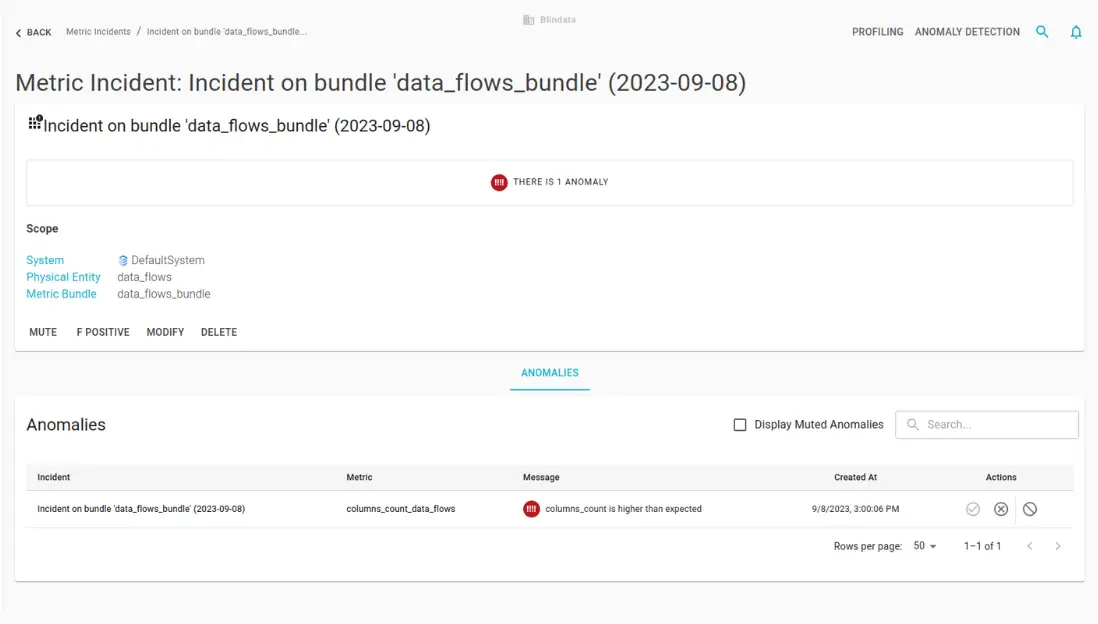
Incidents Reporting
Notify unexpected incidents to the correct data stewards. Blindata’s intelligent system tracks issues and incidents, providing an unmatched vantage point.
How To
SQL-based profiling is the core of our data observability solution, as it offers several advantages over other methods.
Extreme personalization: it allows you to customize and extend the profiling metrics according to your specific needs and preferences. You can use SQL queries to define and calculate any metric that is relevant for your data quality, such as completeness, validity, accuracy, consistency, timeliness, uniqueness, or cardinality. You can also use SQL functions to perform complex transformations, aggregations, or validations on your data.
Preserved confidentiality: it allows you to protect sensitive or confidential data from unauthorized or exposure. You can use SQL expressions to anonymize or exclude any data whose aggregates or metrics may disclose confidential information, such revenues, wages and other confidential datasets.
Costs saving: it allows you to optimize the performance and efficiency of your data observability process. By using SQL commands you can leverage the existing computational capacity and resources of your data sources and systems, without moving or copying any data. This way, you can avoid network costs, latency issues, and data duplication. You can also preserve the confidentiality and integrity of your data by minimizing the risk of data breaches or corruption.
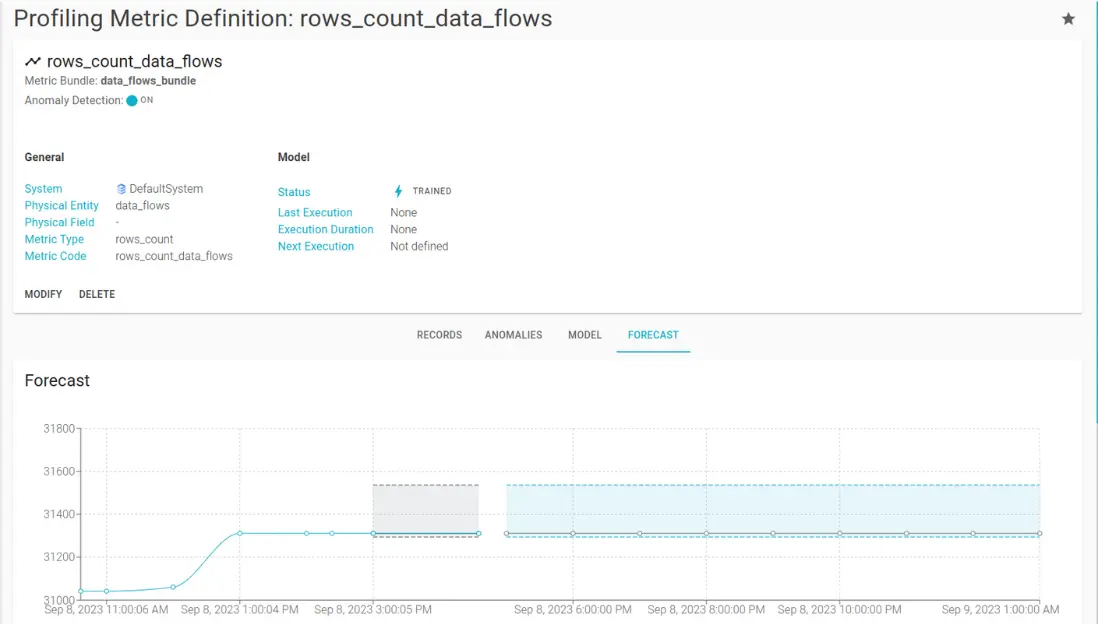
Blindata uses automated machine learning (AutoML) models to find the best solution for the detection of anomalies in the data. AutoML models can automatically select, train, and evaluate the most suitable algorithms and parameters for each data set and metric, without requiring any user intervention or expertise. AutoML models can also handle different types of data, such as numerical, categorical, temporal, or spatial.
Blindata also allows you to fine-tune and adjust the anomaly detection process according to your feedback and preferences. You can always override or modify the AutoML models and parameters if you want to customize or improve the results. You can also flag any false positives or false negatives that the models may produce, and provide additional labels or annotations to enhance the accuracy and precision of the models.
Our ML process is optimized for the scalability and efficiency of your data observability pipelines. Blindata uses machine learning techniques to adjust the required computational capacity according to the forecasting capabilities of the underlying model, for example by automatically configuring the training frequency of the models according to the data update rate and volatility.
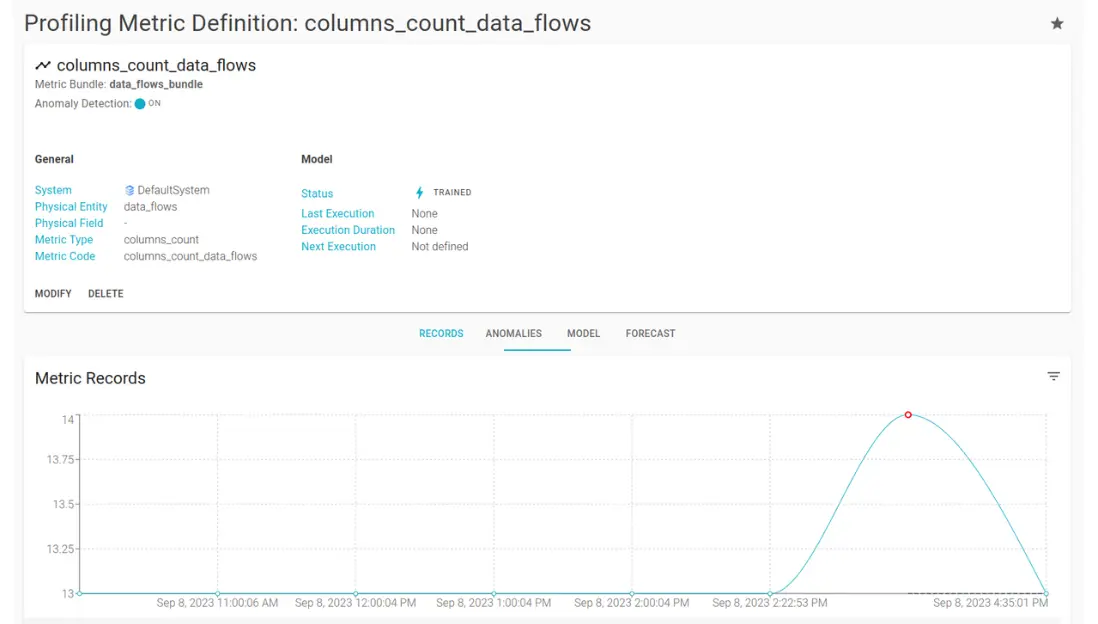
Anomaly detection is based on the forecast of the AutoML models that analyze the profiling metrics. The models can predict the expected values and ranges of the metrics based on historical and current data. If the actual values of the metrics deviate significantly from the predicted values, an anomaly is detected.
Upon the detection of one or more anomalies, an incident is created. An incident is a record that contains information about the anomaly, such as the data source, the metric, the value, the timestamp, the severity, and the root cause. An incident also provides suggestions and recommendations on how to resolve or prevent the anomaly by providing access to the other data governance features of Blindata.