
Consider a data governance lead three quarters into a catalog and glossary rollout. The steering committee asks for a status update. The team reports hundreds of registered data products, a Business Glossary with dozens of namespaces, and a marketplace that is “live.” Yet analysts still file tickets asking which table holds Active Customer, product owners cannot say who consumes their output ports, and a schema change in Finance triggers an outage in Marketing because nobody mapped downstream impact.
The problem is rarely lack of tooling. It is lack of measurable signals that connect governance activity to business outcomes. Without them, programs optimize for registration volume (more terms, more products, more crawled tables) while the conditions for trust, reuse, and accountability stay invisible until something breaks.
This article proposes a multi-dimensional monitoring framework for data governance, the catalog, and the data product portfolio. Each dimension answers a distinct question about maturity. Together they help you distinguish a catalog that is populated from one that is adopted, a glossary that exists from one that grounds daily decisions, and a product portfolio that is listed from one that is structurally and commercially reused.
The goal is not more dashboards. It is to turn qualitative governance goals into repeatable KPIs you can baseline, target, export for remediation, and review on a cadence, using what Blindata already surfaces in its success metrics views.
Why one score fails
Data governance spans multiple layers of your Enterprise Information Architecture:
- The Data Catalog inventories physical assets: systems, entities, fields.
- Data Products package curated, consumable assets with ports, ownership, and lifecycle.
- The Business Glossary (and, at higher maturity, the ontology in the Knowledge Plane) defines shared business meaning.
- The Data Marketplace, when enabled, governs who may consume which products and captures the business context of each request.
Each layer can look healthy in isolation while the whole system underperforms. A glossary with rich definitions but zero links to physical columns cannot support discovery or policy enforcement. Data products with complete descriptions but no assigned owner will drift within a quarter. A marketplace with approved requests but no structural port dependencies may reflect ad hoc access, not composable architecture.
Collapsing these into one aggregate score (“metadata completeness: 78%”) hides the failure modes that actually block adoption:
| Symptom teams report | What a single score misses |
|---|---|
| “Analysts don’t trust the catalog” | Empty descriptions, missing documentation, weak semantic links |
| “We don’t know who owns what” | Ownership gaps, missing roles, workload imbalance |
| “Our best products broke downstream teams” | Undocumented port dependencies, no impact analysis before change |
| “The marketplace is quiet” | Low engagement among business users, or products not published for consumption |
| “We built a glossary nobody uses” | Concepts not linked to catalog assets; attribute-level gaps on critical fields |
A monitoring framework
A workable program uses complementary KPIs, each tied to a clear purpose. The table below is the map; the sections that follow explain how to measure and act on each dimension in Blindata.
| Dimension | Core question | Leading or lagging | What good looks like |
|---|---|---|---|
| Linking business terms to data | Does business meaning reach physical data? | Leading | Shared definitions linked across products; attribute-level coverage on critical fields; semantic interoperability across domains |
| Ownership and responsibilities | Is ownership explicit and sustainable? | Leading | Roles assigned, requested roles filled, workload balanced across stewards |
| Metadata fill rate | Is defined metadata actually populated? | Leading | Standard fields, custom properties, and documentation at domain-specific targets |
| Portfolio reuse | Which products matter architecturally? | Lagging (design-time) | Hub products identified; internal vs cross-domain reuse mapped; publish-heavy domains distinguished from platform providers |
| Marketplace adoption | Who actually consumes products? | Lagging (runtime) | Active providers across domains; healthy request funnel; consumer mix reflects intended use (people, apps, composed products) |
| User engagement | Is the platform embedded in daily work? | Lagging | Sessions and page views growing among business and technical segments |
Leading indicators (business term linking, ownership, fill rate) predict future trust and reuse. Lagging indicators (portfolio reuse, marketplace activity, engagement) confirm whether the investment is paying off. Mature programs track both and investigate when they diverge.
Linking business terms to data
The objective is semantic interoperability: a shared understanding of what data means, not only where it is stored. When physical assets and data products are tied to the same Business Glossary definitions, teams can combine products across domains, govern them through one vocabulary, and give humans and AI the same context. Without that alignment, even a well-stocked catalog stays a collection of local dialects: accessible, but not truly reusable.
Data grounded in shared definitions is easier to consume and reuse. A consumer can compare products from Finance and Marketing because both refer to the same concept of Customer or Revenue, not similar column names with different rules. That is what makes composition across data products practical rather than fragile.
The same links support governance and AI:
- Governance: Computational policies, quality rules, and access decisions can reference glossary concepts that are anchored to real fields and entities, not free-text labels.
- AI and agents: models and copilots need explicit business context. Linked metadata gives them a stable map of meaning instead of inferring intent from table names alone. As we describe in Architecting the Knowledge Plane, that shared vocabulary is what turns implicit expert knowledge into something machines can reason over reliably.
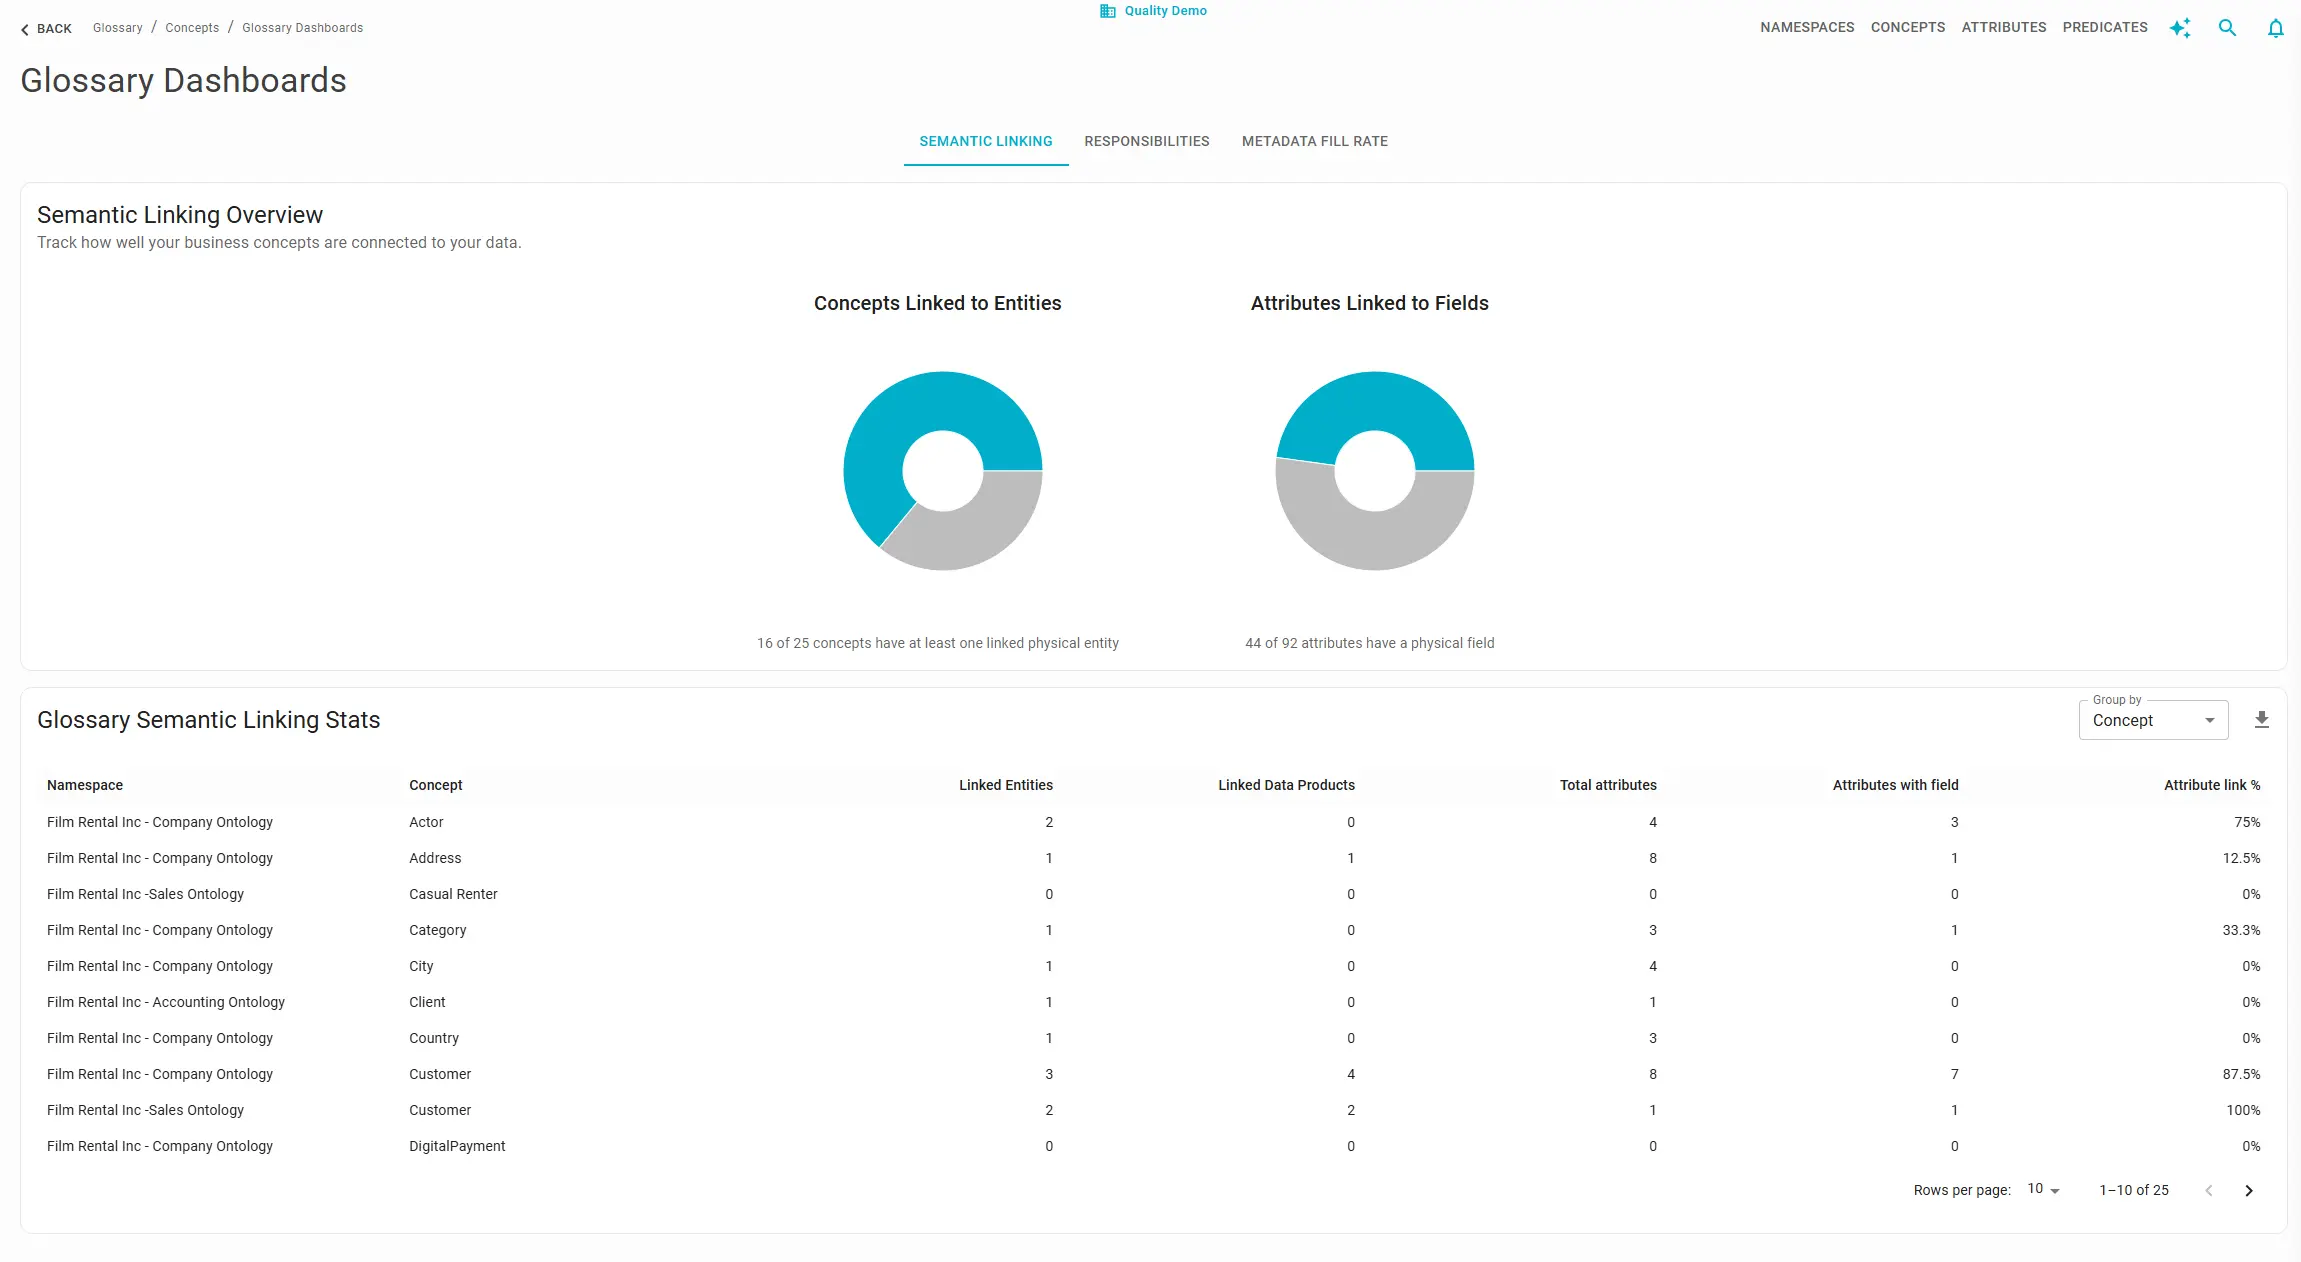
In Blindata this is tracked as semantic linking: connecting glossary concepts and attributes to physical entities and fields in the catalog and in data product output ports. It is not the same as tagging a column with a business term. Tagging identifies; semantic linking contextualizes by connecting a field to a glossary attribute through a defined relationship, so the system knows which address is the shipping address, not merely that a column “is an address.”
Monitoring linking coverage tells you how far your organization has moved toward that interoperable layer. Without it, the glossary stays a standalone dictionary, products cannot be governed in business language, and semantic search lacks a stable anchor.
What to track at two granularities:
- Entity / concept level: share of glossary concepts with at least one linked physical entity; share of data product output-port entities with at least one linked concept.
- Field / attribute level: share of glossary attributes with at least one linked physical field; share of product output-port fields with at least one linked attribute.
Entity-level coverage alone is misleading. A domain can link every table to a concept while leaving critical columns (such as amount, status, or effective date) unlinked. These attribute-level gaps are where discovery and policy enforcement usually fail.
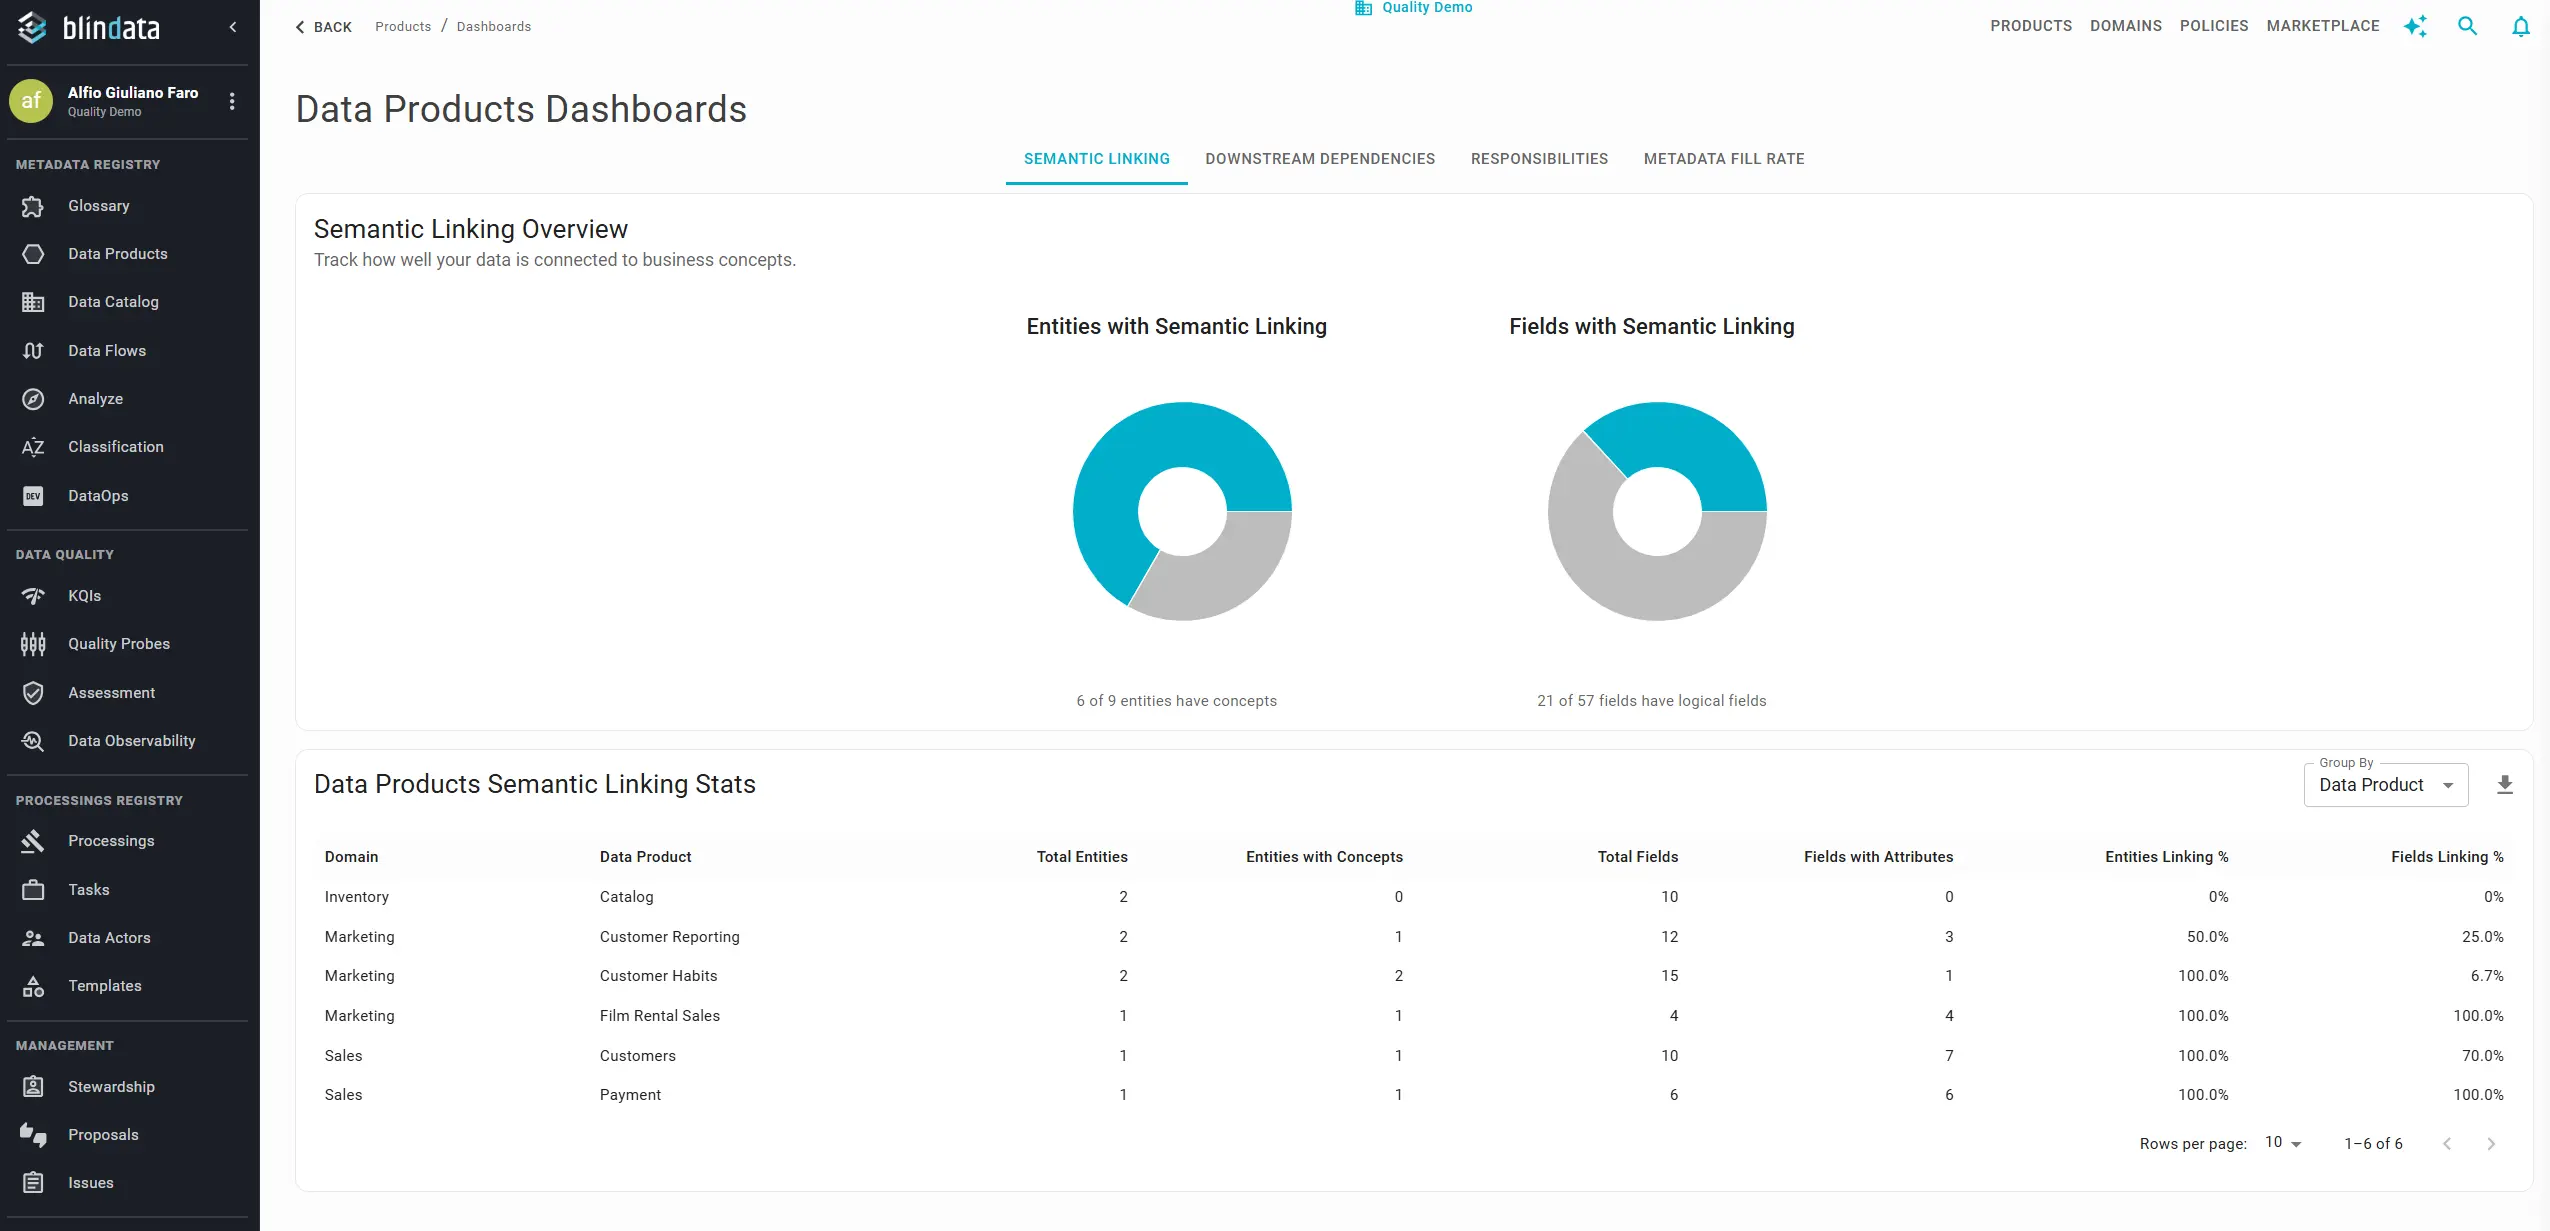
Monitor from both perspectives. Blindata tracks semantic linking from both the Business Glossary and the Data Products dashboards because a high coverage score on one side can mask significant gaps on the other:
- Glossary-heavy, catalog-light: A domain (like Finance) maintains a mature business glossary namespace. Looking at the glossary dashboard, linking looks strong because nearly every glossary concept is linked to some data asset. However, the Data Products dashboard reveals that a vast majority of published schemas and columns remain unlinked. This discrepancy masks a massive coverage gap. Because the actual data products lack attribute-level links, they cannot be discovered using business terms, leading to semantic isolation, a lack of semantic interoperability across domains, and a failure to enforce automated column-level policies.
- Product-heavy, glossary-light: A domain (like Engineering) actively publishes well-structured data products with detailed schemas, but the glossary dashboard shows that very few defined business terms are linked to them. A large portion of the business glossary remains unmapped to the actual product portfolio, making those glossary terms unused. This undermines trust in the glossary itself: business users find clear definitions of concepts, but because no data products are linked to them, they cannot access the actual data, leading them to believe the data is unavailable or non-existent.
Remediation depends on your operating model. A practical sequence is to baseline both dashboards by domain or namespace, prioritize areas with high concept linking but low attribute linking, and export CSV lists by concept or data product for targeted work. How you close gaps from there varies by team maturity:
- Centralized remediation: glossary or catalog stewards fix links directly in the UI, through spreadsheet upload, Data Classification, or JDBC crawl when mappings already exist upstream.
- Shift-left on data products: domain teams define semantic links in the Data Product Descriptor before publication, so output-port schemas arrive in the catalog already grounded in shared business terms. This aligns with the shift-left governance model: the product owner, not a downstream cleanup squad, carries meaning into the portfolio.
- Assign accountability: for gaps on published products, open an issue on the data product to notify the assigned owner or team. Issues surface on the product detail page and in My Work, turning dashboard exports into actionable work items rather than static reports.
Choose the mix that fits your organization: some domains will need steward-led CSV campaigns; others can move linking into descriptor workflows and issue-driven follow-up with product owners.
Example targets by maturity stage:
| Stage | Realistic focus | Example target |
|---|---|---|
| Foundation | Link critical entities in one pilot domain | 80% concept linking, 50% attribute linking in Finance |
| Expansion | Attribute-level coverage on KPI fields across domains | 70% attribute linking portfolio-wide |
| Optimization | Semantic paths on ambiguous fields; policy-ready coverage | 90%+ on governed attributes tied to active policies |
Documentation: Track Business Glossary Maturity · Monitor Your Data Product Portfolio
Ownership and responsibilities
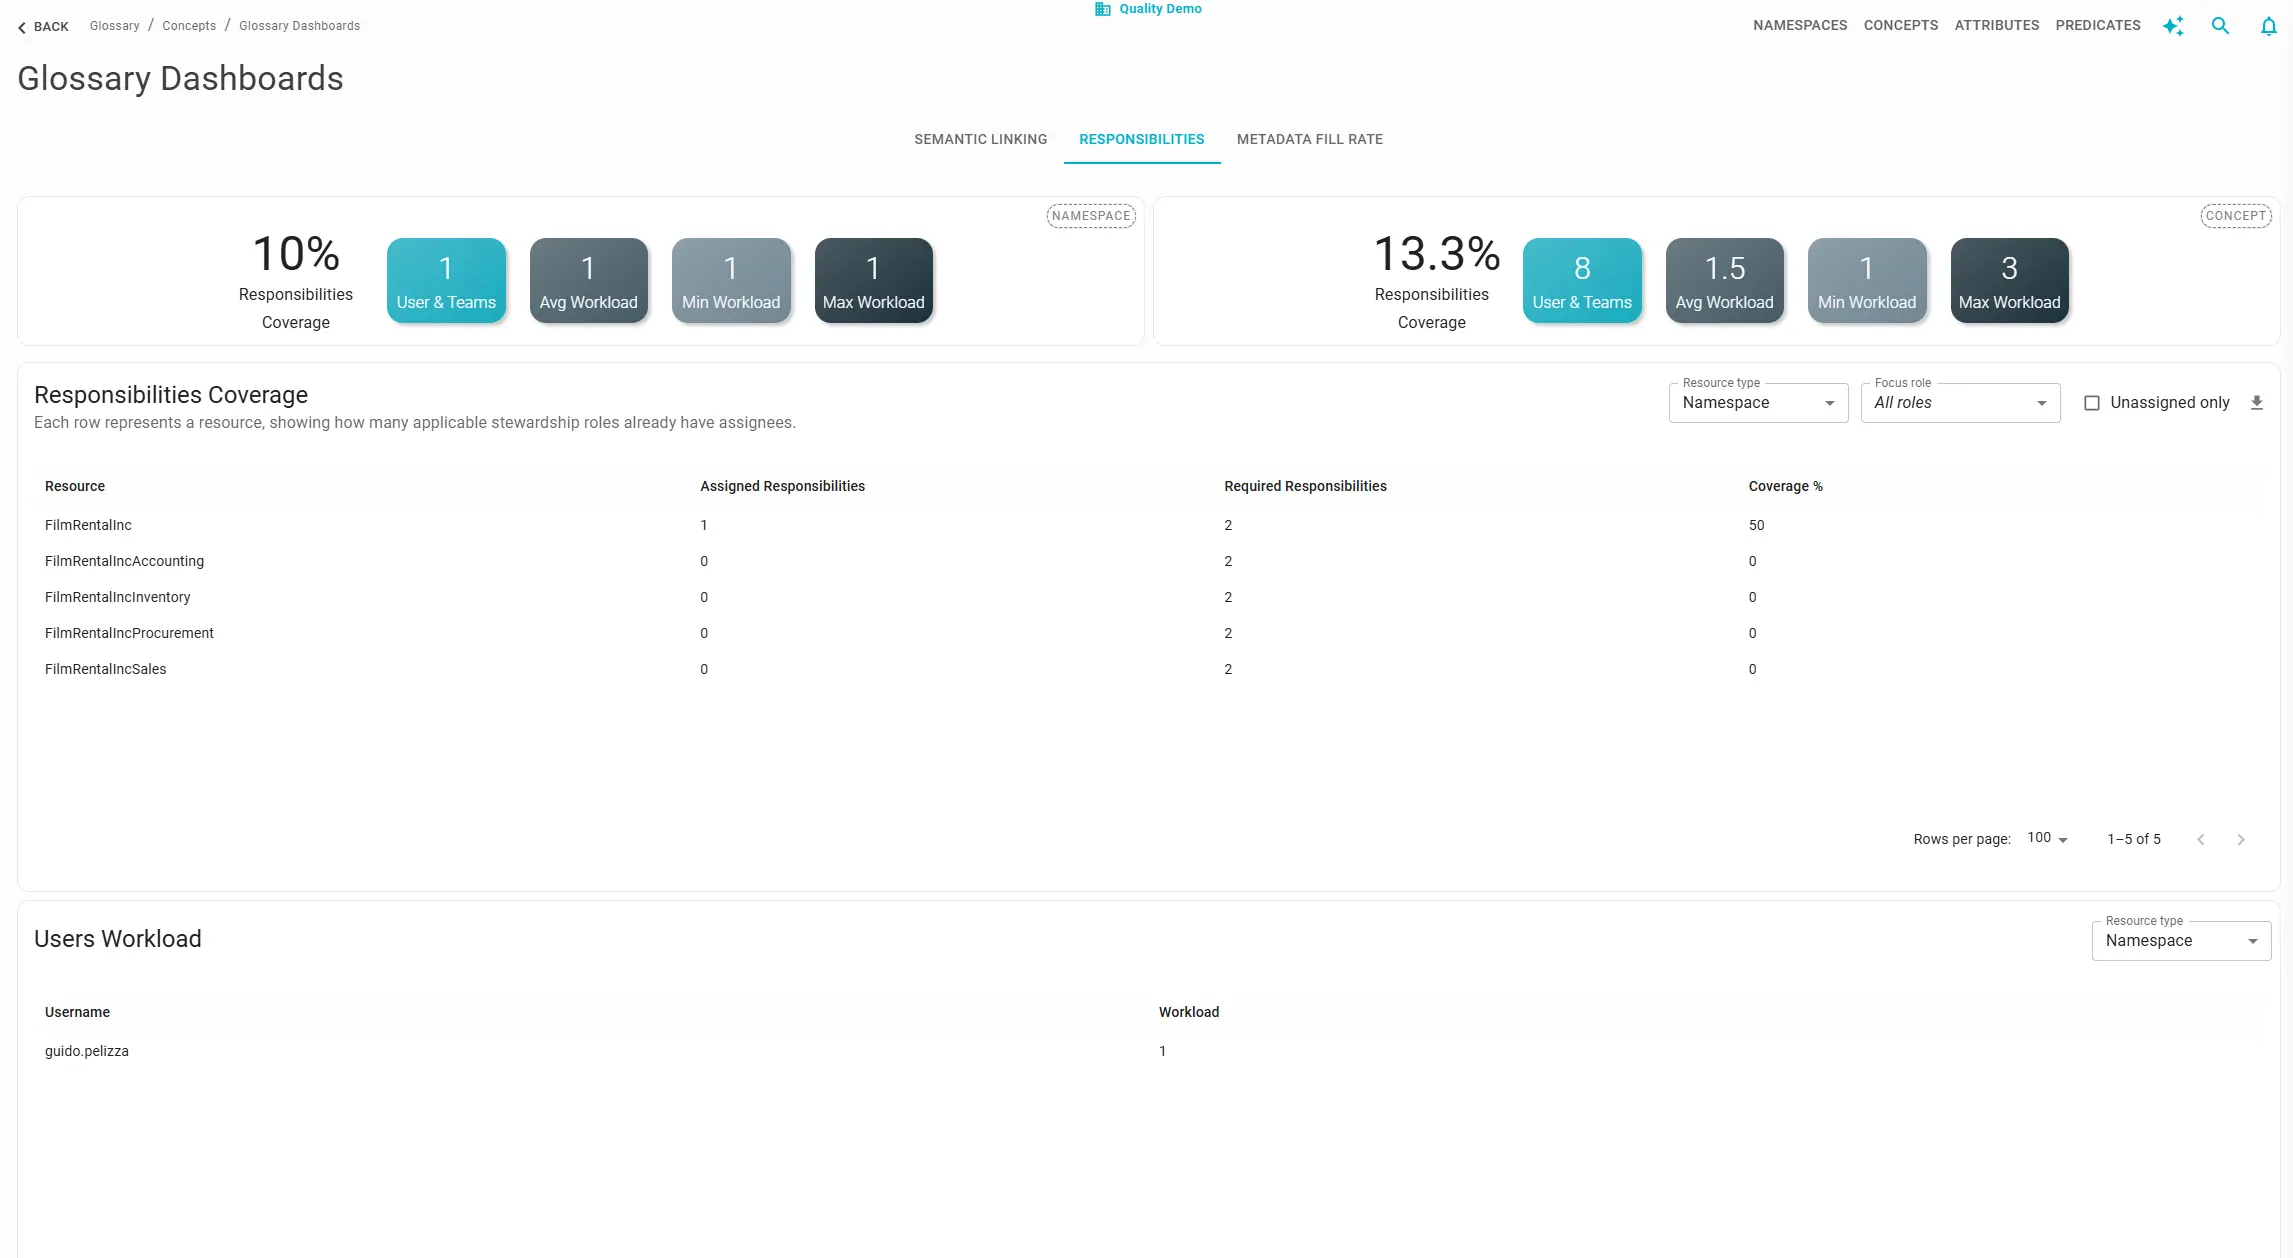
Governance programs fail quietly when ownership is ambiguous: no one updates metadata, approves access, or keeps definitions current. In Blindata, stewardship captures who is accountable through assigned roles and responsibilities. Track it to keep the catalog maintainable as it scales by answering three questions:
Coverage: What share of namespaces, concepts, or data products has at least one assigned responsibility? Zero-coverage resources are liabilities: metadata will not be updated, access requests will queue, and fill rate targets will never be met.
Role completeness: Blindata distinguishes assigned responsibilities from requested coverage, the roles your governance model expects on each resource type. A product with a “Data Owner” but no “Technical Steward” may satisfy a minimal coverage percentage while still failing your operating model.
Workload balance: The user workload table shows how many responsibilities each person holds. Pair it with the resource coverage table in the same session: fill gaps without concentrating every new assignment on the same individual.
When Stewardship ACL is enabled on the Business Glossary, responsibility assignments also control edit permissions; coverage gaps directly translate into unmanaged, editable resources.
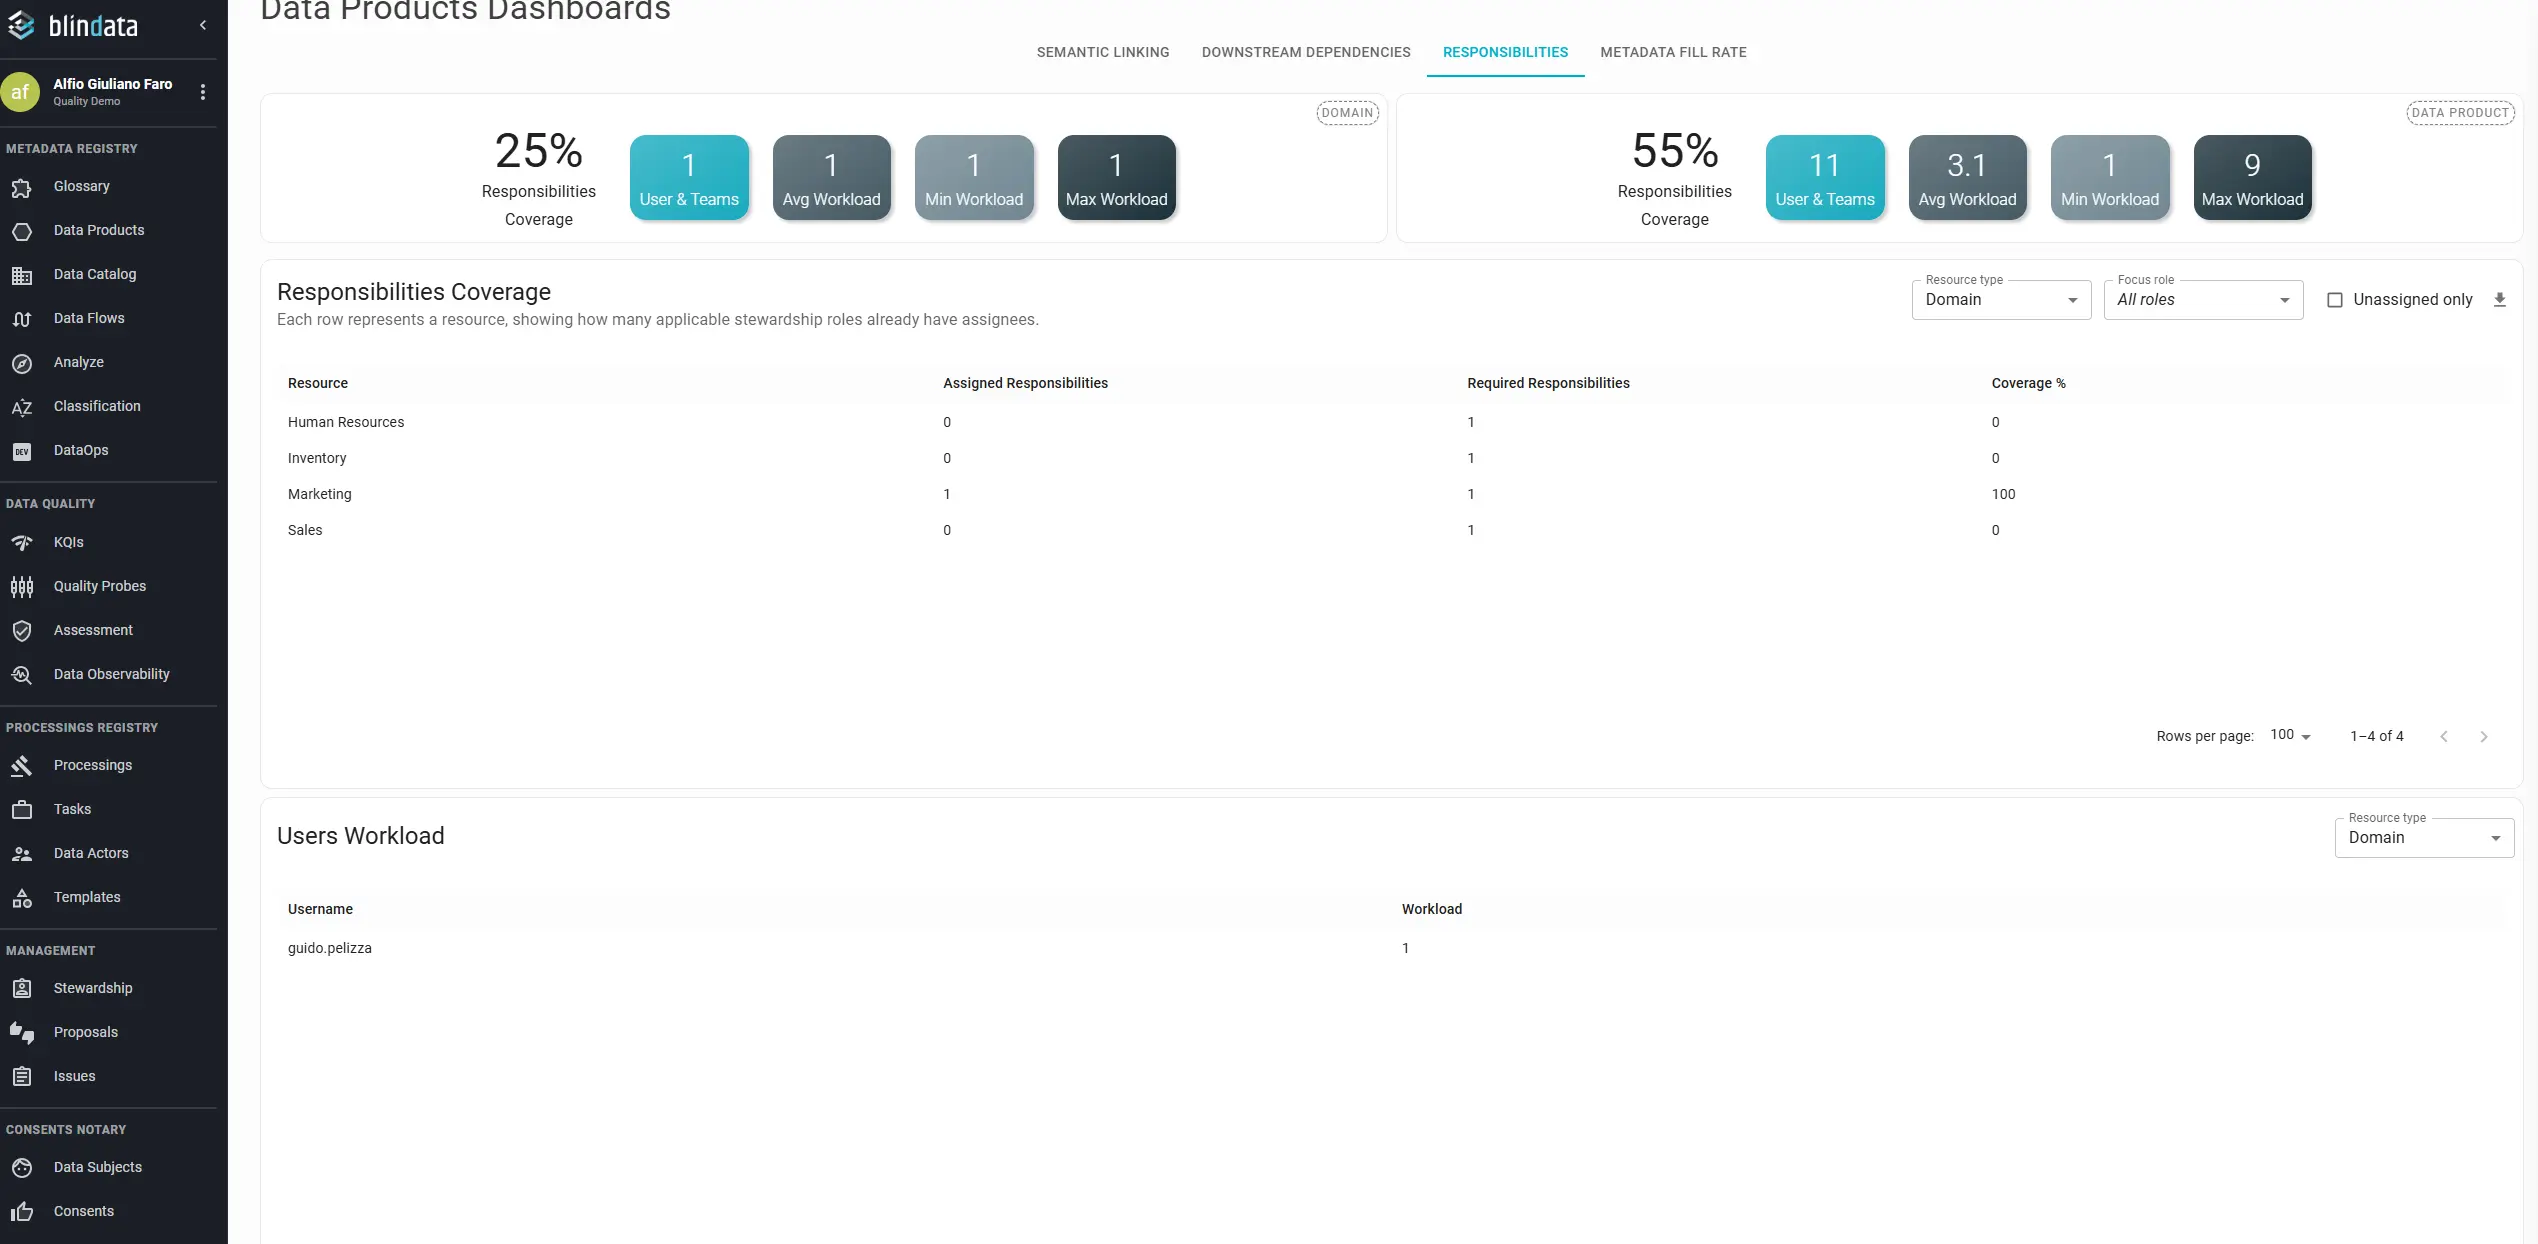
For portfolio-wide views, use the Stewardship module dashboard, including min/max workload per resource type.
Anti-patterns: the hero steward (one person holds 60%+ of responsibilities); launch without owner (products registered with zero roles); role theater (100% coverage with only a generic “Contributor” everywhere). Define requested roles per resource type and track completeness, not just count.
Metadata fill rate
Defining metadata fields is easy. Populating them consistently across hundreds of concepts or products is where most programs stall. Fill rate monitoring turns policy statements like “every production product needs a description and status” into auditable percentages scoped by domain, filterable field by field, exportable for remediation sprints.
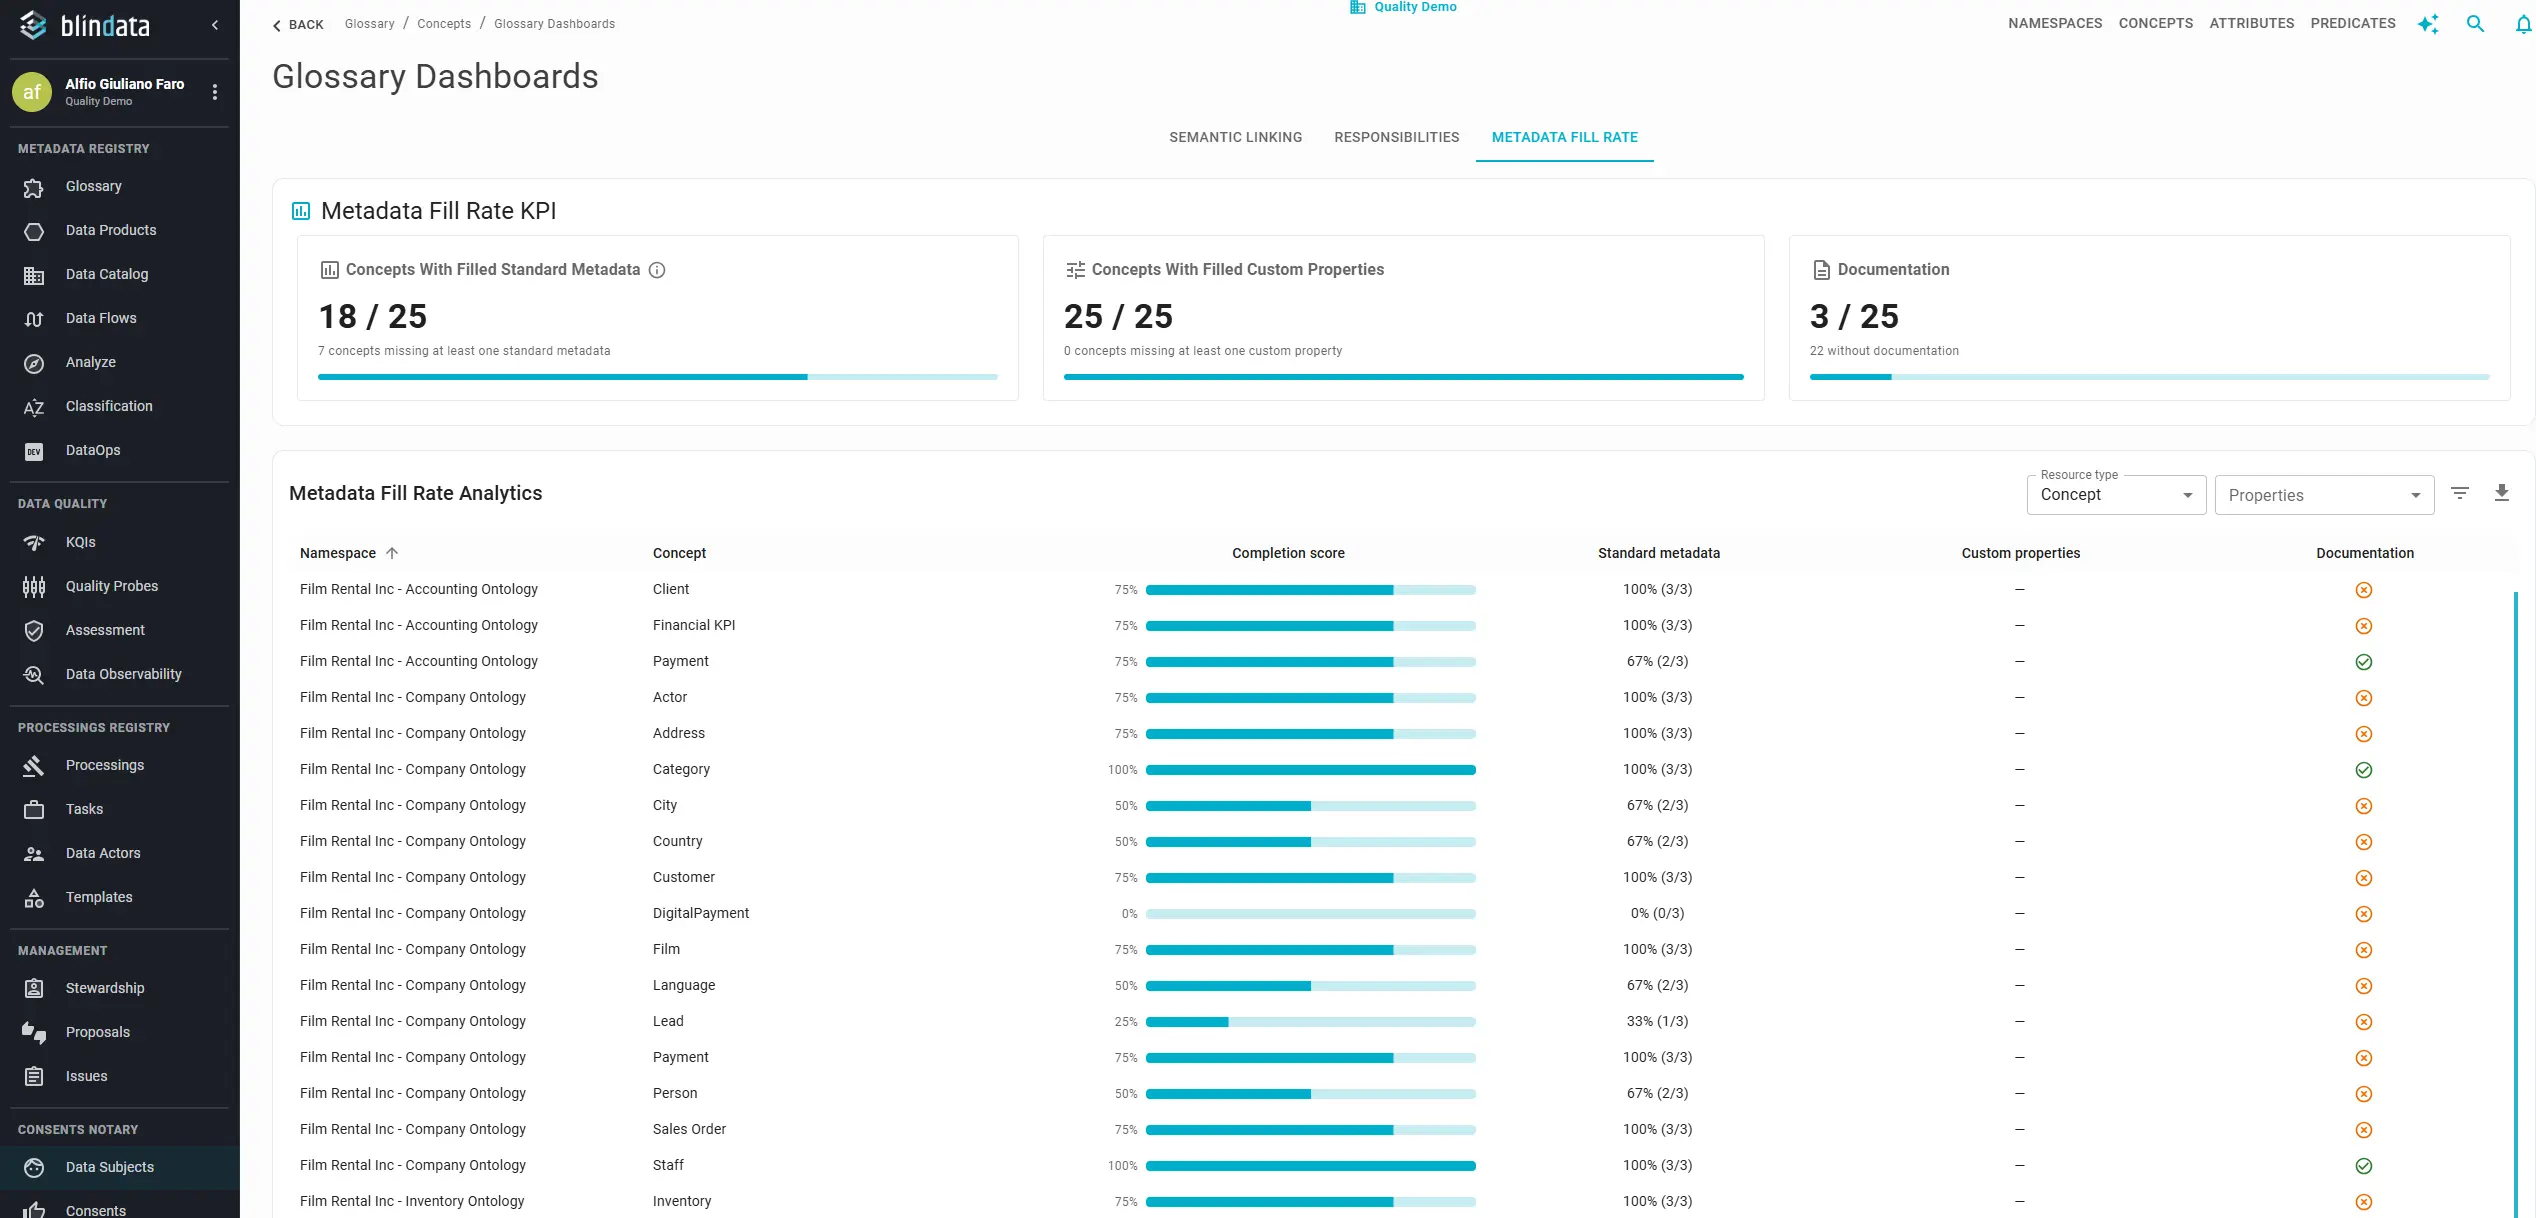
Blindata’s Metadata Fill Rate dashboard summarizes portfolio health through three roll-ups:
| Roll-up | What it measures | Why it matters alone |
|---|---|---|
| Standard metadata | Core fields such as Description, Product status, Product type (products) or Description, Clearance, Data class (concepts) | Minimum viable discoverability |
| Custom properties | Organization-specific tags: regulatory class, lifecycle stage, cost center, sensitivity | Governance rules and search filters depend on these |
| Documentation | Markdown documentation sections populated on the resource | Consumer trust and onboarding |
A product can score 100% on standard metadata but 0% on documentation; that may be fine for an internal staging asset, but it is unacceptable for a marketplace-published product. Track roll-ups separately; do not average them into one number.
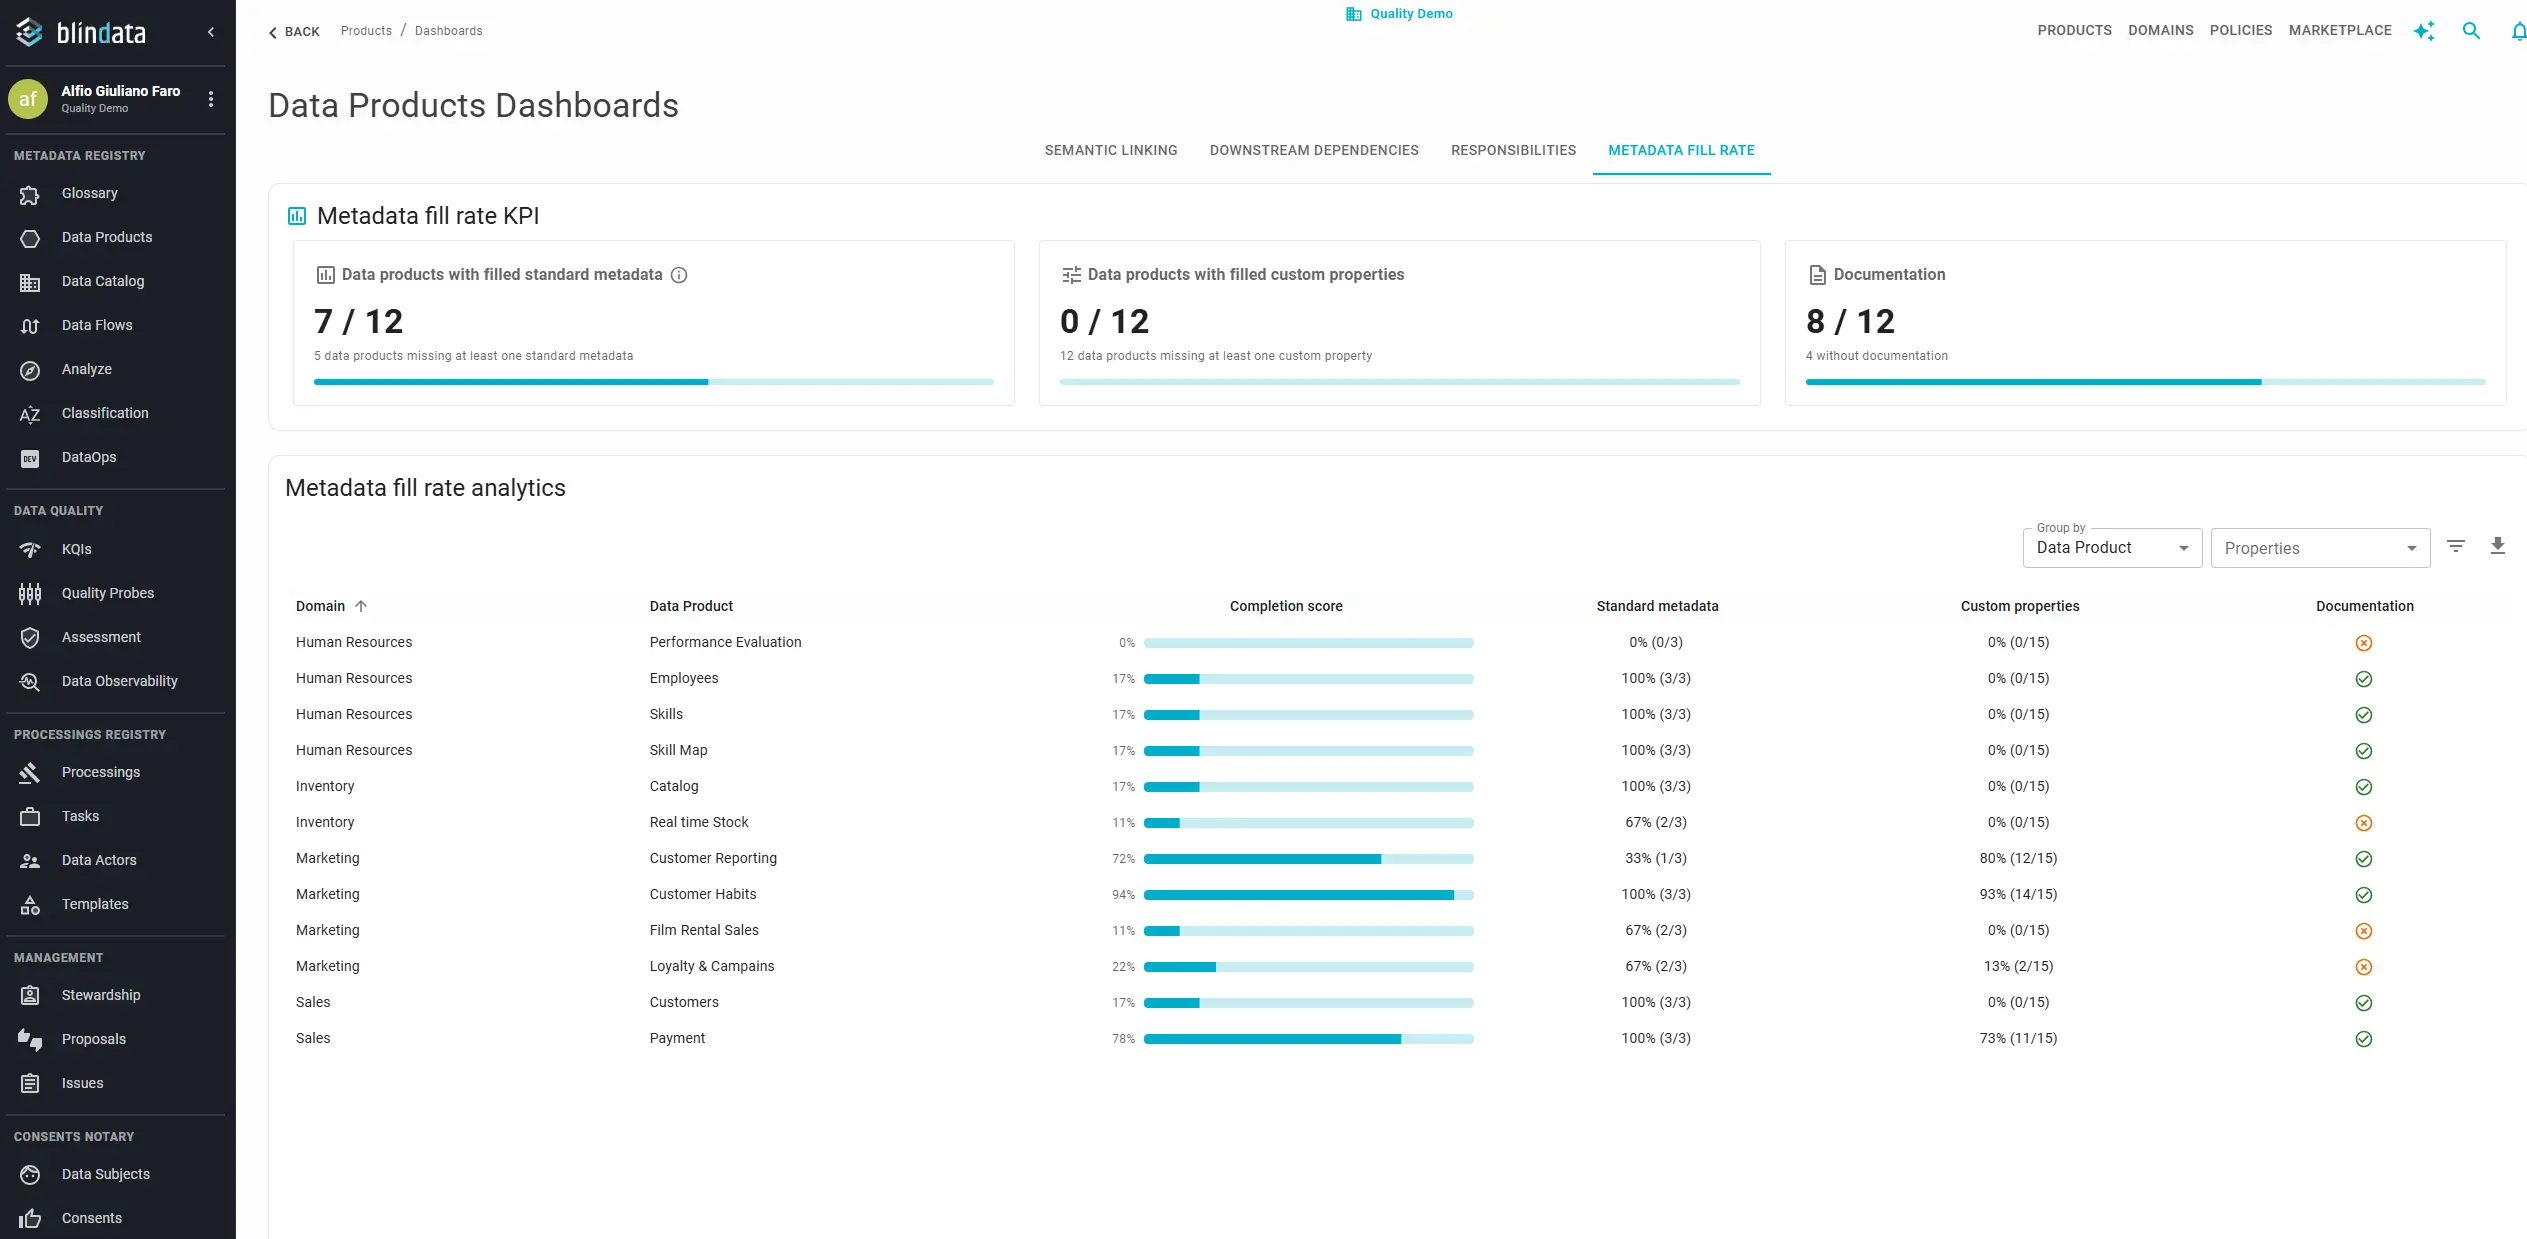
Field-level audits: open Properties to add columns for specific standard fields or custom properties; use Filters to combine conditions (for example, namespace = Finance AND Description is empty); export CSV matching exactly what is on screen for sprint backlogs or compliance reviews.
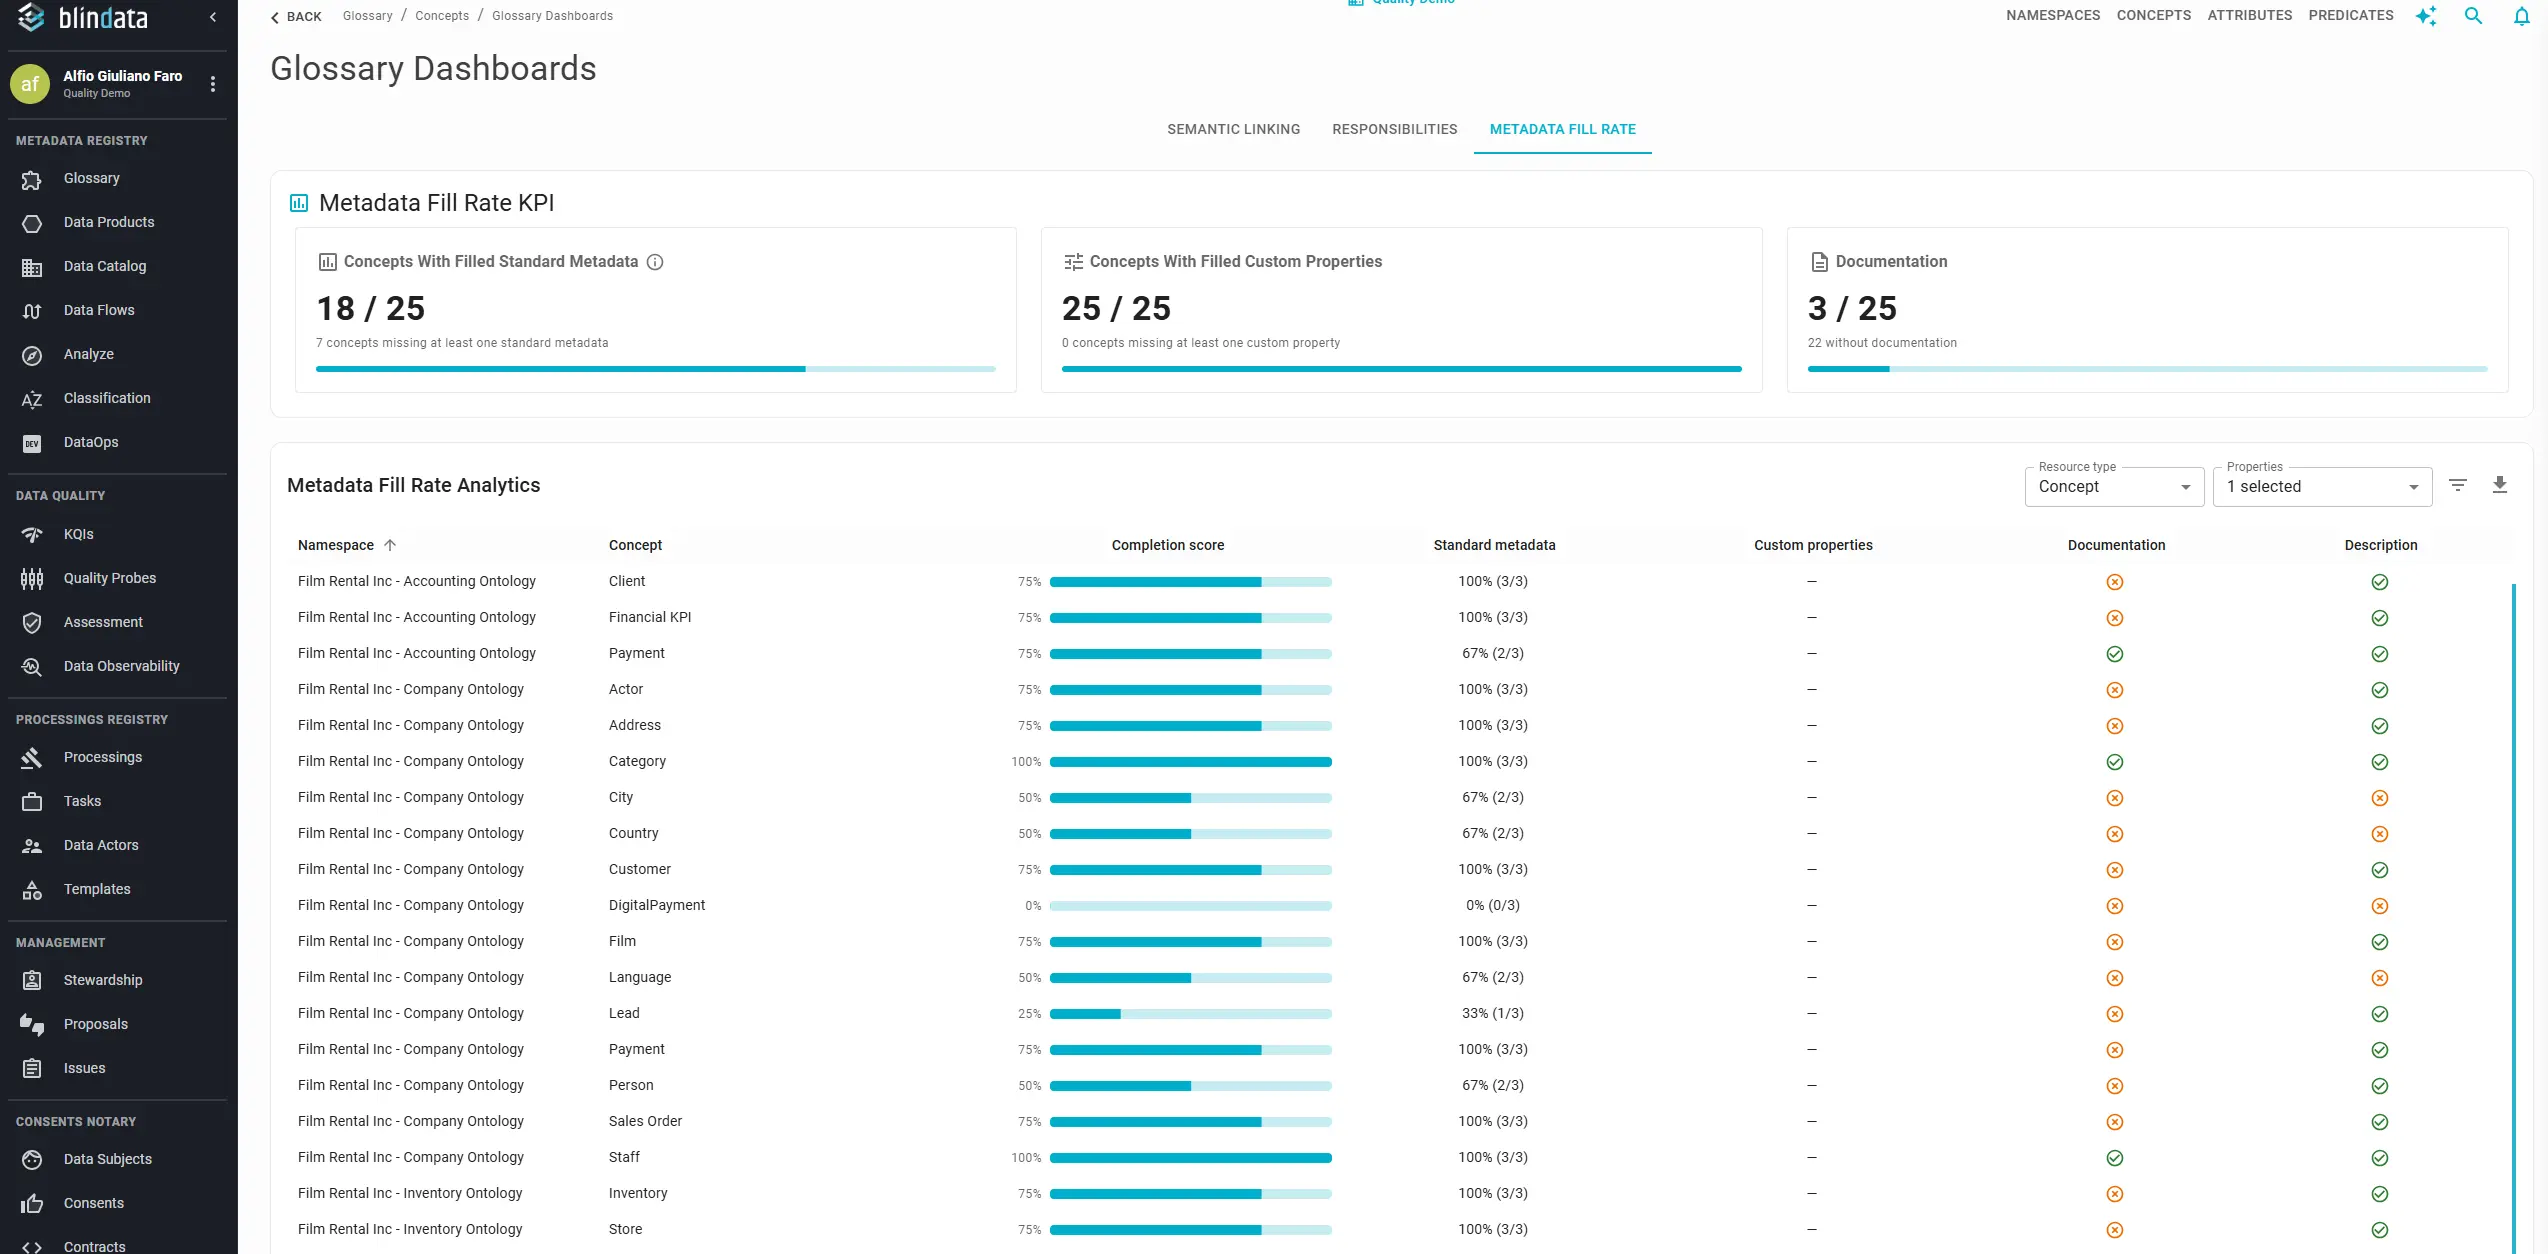
Rendering rules on custom properties keep forms manageable, showing fields only when relevant. Use fill rate as a gate before sign-off: a production-ready product might require 100% Description and Product status before marketplace publication.
Portfolio reuse
A large product catalog is not the same as a valuable portfolio. Domains can publish dozens of data products that nobody composes into anything else: each asset may be documented and owned, yet the organization still duplicates datasets, rebuilds the same joins, and carries the full cost of every producer with none of the multiplier effect that data-as-a-product promises.
Reuse is where portfolio value compounds. When a data product is declared as an input port dependency on another product’s output port, it becomes a building block: other teams design against a stable contract instead of re-sourcing raw tables. A product with many downstream dependents is doing more work for the enterprise than a product that exists only for a single report. That is not a vanity metric; it is a structural signal of composability, the same quality that separates a curated product catalog from a passive inventory (Architecting the Information Layer).
Monitoring reuse answers portfolio questions that product counts alone cannot:
- Which products deserve platform-grade investment? High downstream counts identify hubs that need stable schemas, clear SLAs, and careful change management before any port change.
- Which domains publish assets others build on? External-domain dependencies reveal platform providers: domains whose products cross boundaries and enable work outside their own team.
- Which domains publish volume without impact? Many products and zero dependents may indicate a publish-heavy, reuse-light pattern worth reviewing with domain leads.
- Where does consumption stay local? Same-domain dependencies show healthy internal composition within a bounded context; the portfolio may be cohesive but not yet reaching the rest of the organization.
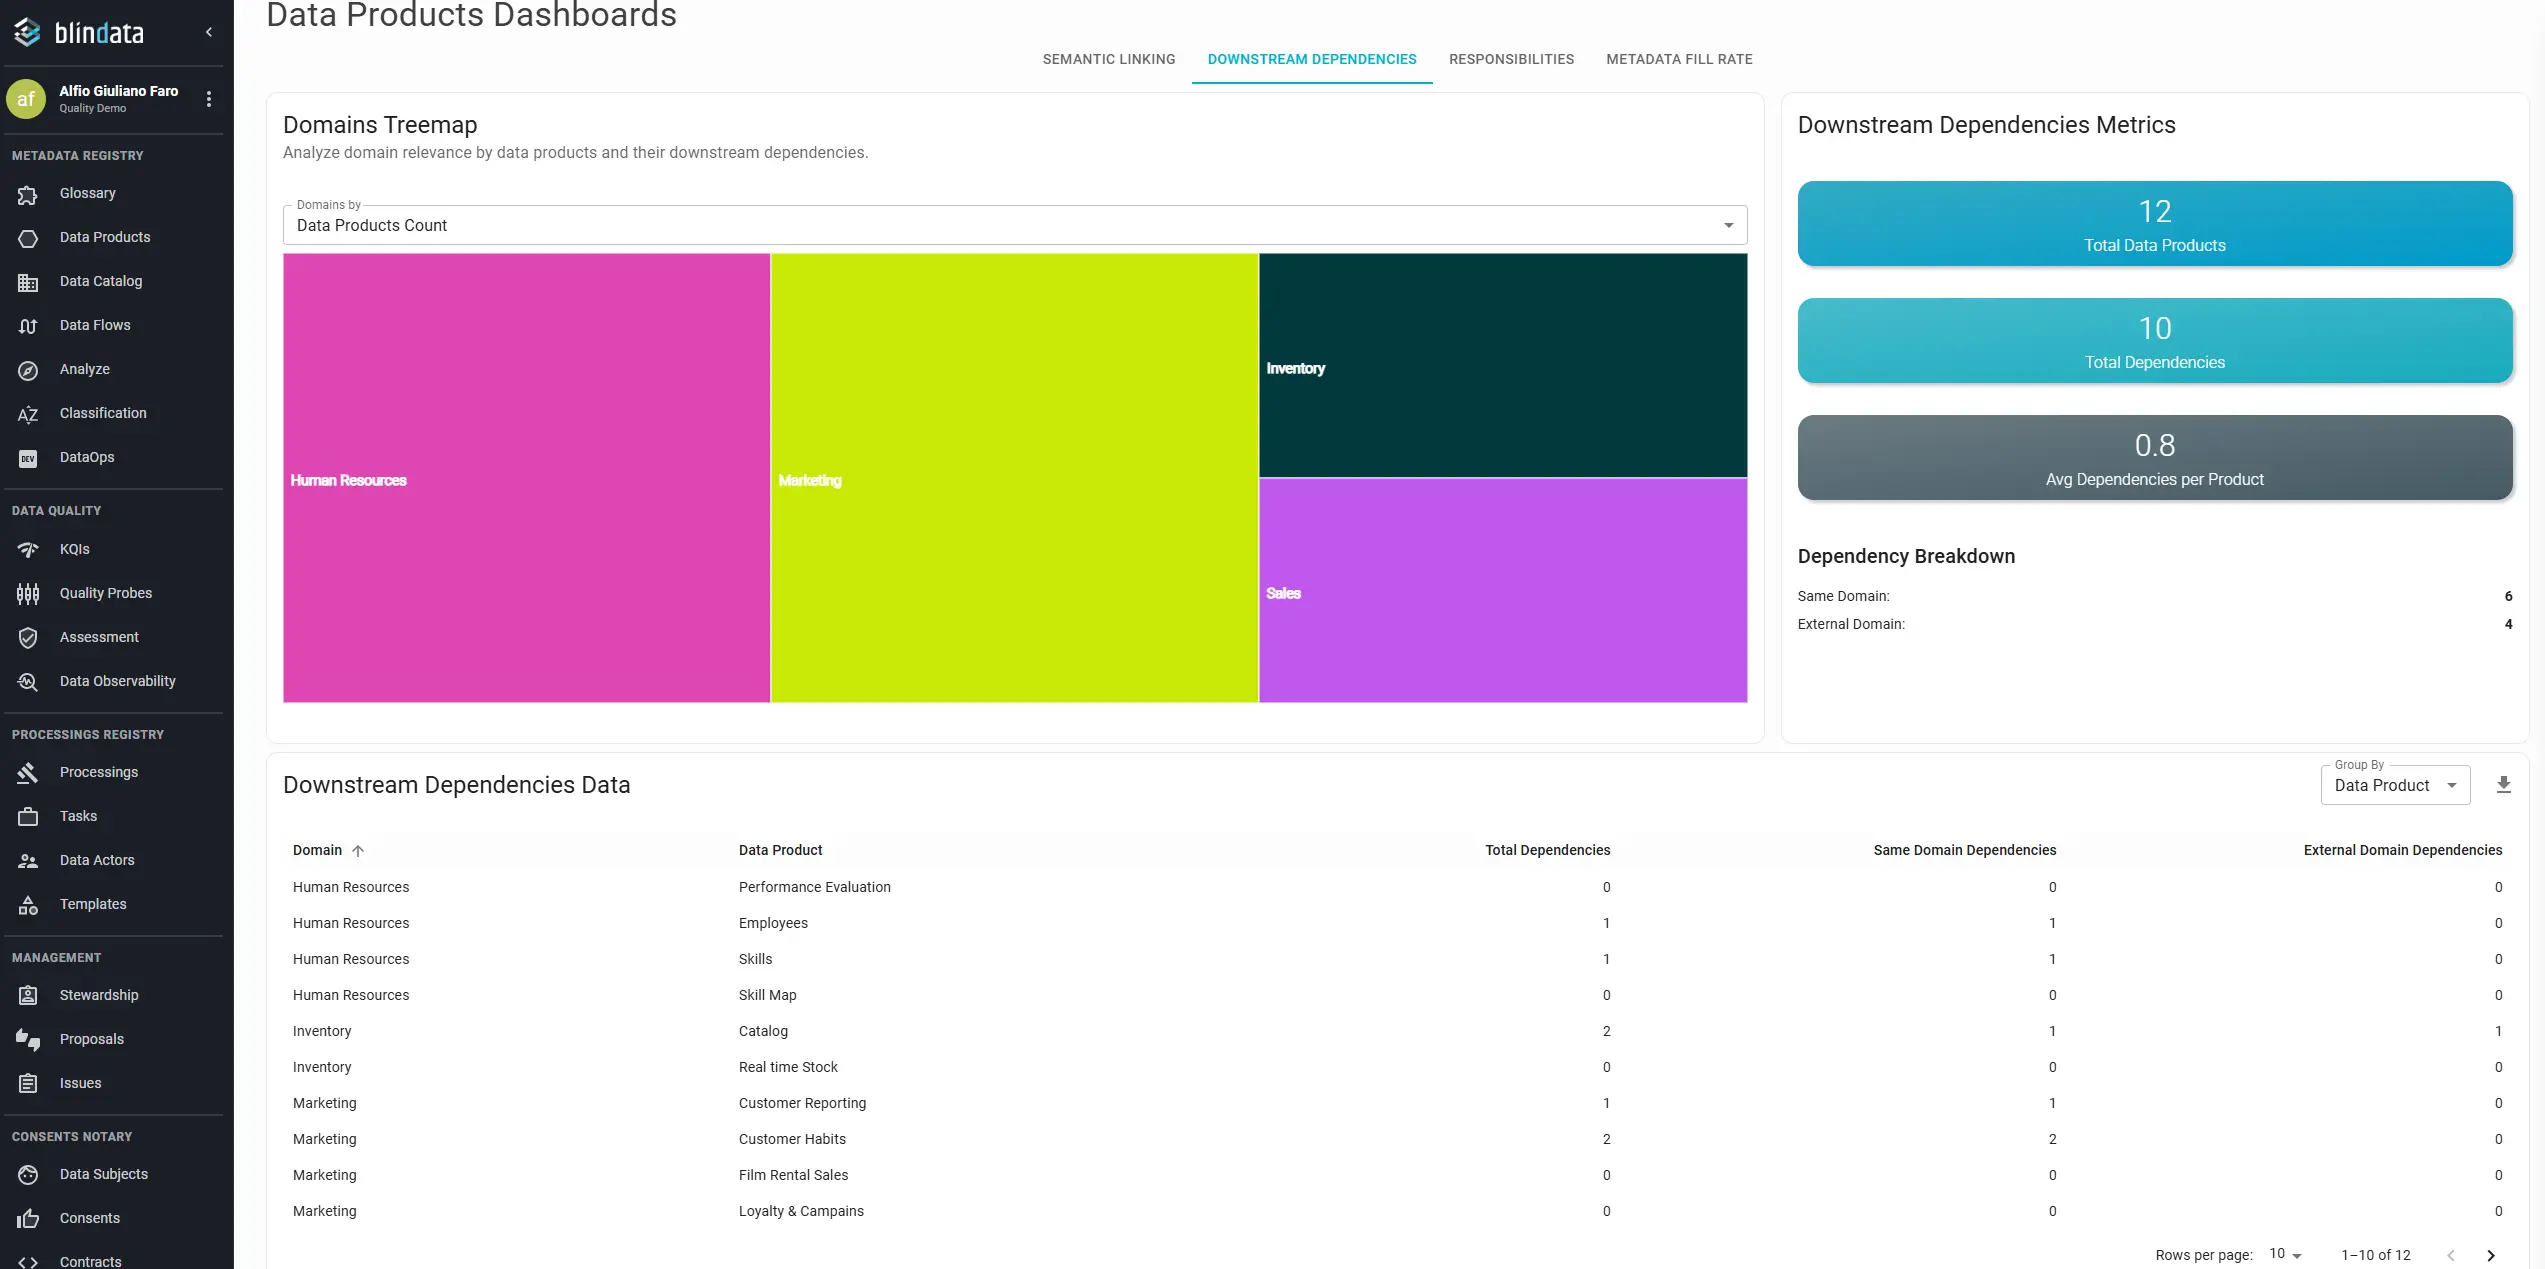
The Downstream Dependencies dashboard in Blindata tracks this design-time wiring: which data products structurally depend on one another through declared port relationships, not ad hoc copies in a warehouse.
For each producer product, Blindata counts:
- Dependent data products: how many distinct products declare a dependency on this product’s output port(s).
- Same-domain dependencies: dependents in the same domain as the producer (internal reuse within the domain).
- External-domain dependencies: dependents in a different domain (cross-domain reuse).
Portfolio-level summary figures include total products, total dependencies, average dependencies per product, and the split between same-domain and external-domain links. The treemap sizes domains by relevance (products they contain and downstream impact they drive), surfacing at a glance which areas act as large publishers or central hubs.
Reading the portfolio by pattern:
| Pattern | What you may see | What it suggests |
|---|---|---|
| Platform hub | High dependent count, strong external-domain share | A product (or domain) others build on; prioritize contract stability, ownership, and impact analysis before changes |
| Domain pillar | High same-domain dependents, low external | Strong internal composition; consider whether products should be promoted for cross-domain discovery |
| Publish without reuse | Many products in domain, low average dependencies | Registration volume without composability; review whether products are true reusable assets or one-off exports |
| Consumer domain | Few published products, many input dependencies elsewhere | Domain builds on others’ assets; ensure upstream hubs are healthy before local delivery commitments |
| Isolated product | Zero dependents | Not wrong for every case (staging, niche regulatory sets), but worth confirming the product still earns its place in the catalog |
Typical workflows:
- A product owner groups by data product before deprecating a port or changing a schema; downstream counts quantify blast radius on other teams’ products.
- A domain lead groups by domain to compare publish volume vs reuse: are we producing building blocks or isolated datasets?
- A platform or governance team reviews external-domain dependencies to identify organization-wide hubs and align investment, SLAs, and change notification with actual structural impact.
Input ports should be declared as products are designed, ideally in the Data Product Descriptor during build, so reuse is visible before production rather than reconstructed after the fact.
This dashboard reflects declared relationships in the catalog. It answers: who is structurally wired to consume this product? For runtime access and request activity, pair it with marketplace adoption in the next section.
Marketplace adoption
Portfolio reuse tells you who is structurally wired to consume a product. The marketplace tells you who actually requested access and received it. Both matter: a product can be composed into ten downstream products yet never appear in access logs if pipelines inherit permissions elsewhere; conversely, a product can draw heavy request volume while nobody builds on it as a composable input port.
Marketplace adoption is the demand signal for your portfolio. Registration and fill rate prove supply; downstream dependencies prove architectural reuse; marketplace activity proves that humans, applications, and other products are choosing to consume assets through a governed channel. That is where ROI becomes visible: producers see who needs their work and why; governance teams get an auditable record of consumption with business context; leadership can distinguish products that drive decisions from products that sit on the shelf.
The Marketplace Dashboard is organized into two tabs:
Consumers summarizes who is consuming today. Timeline shows how access requests flow over a selected period.
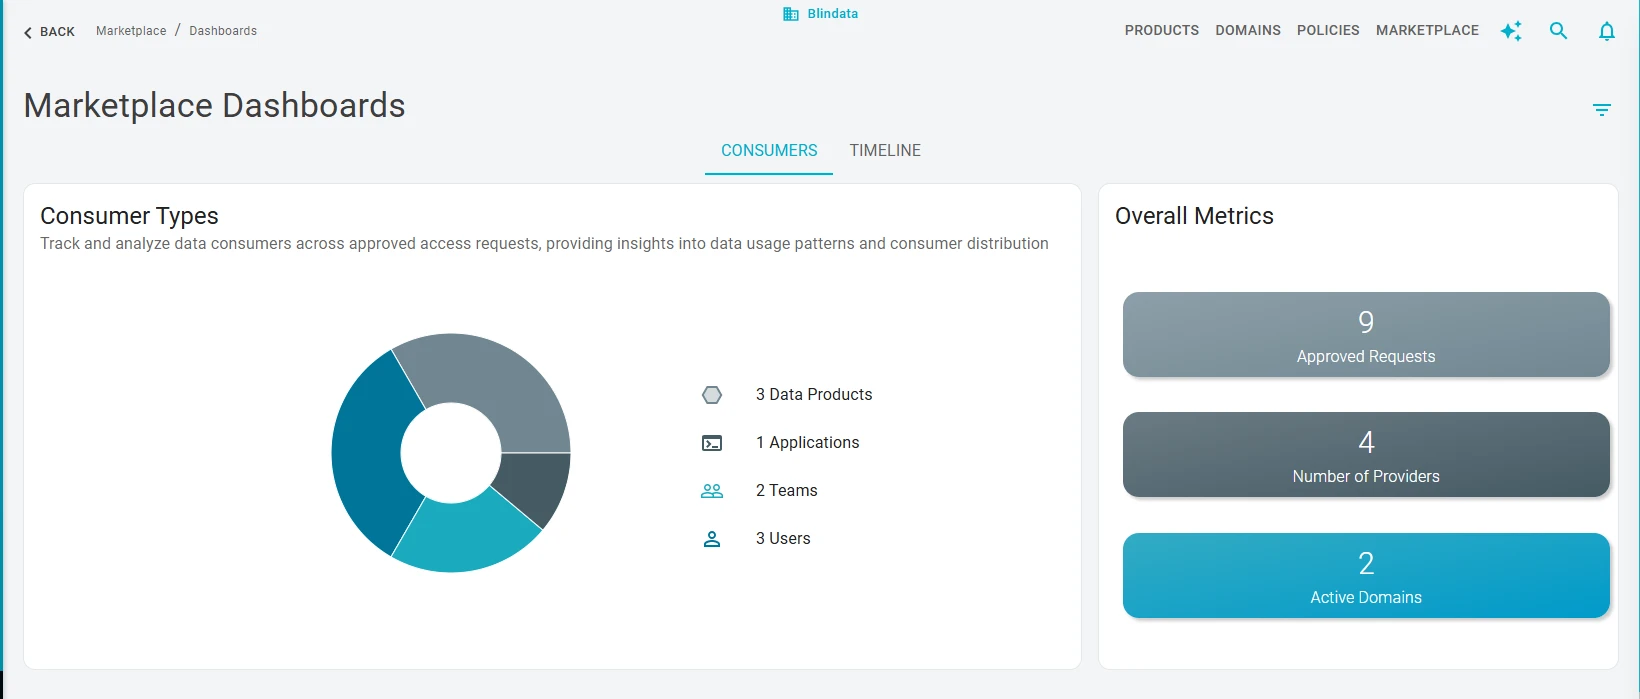
Consumers tab: who is consuming, and where
The summary view answers adoption at portfolio scale:
- Consumers by type (pie chart): Users (individual analysts and stewards), Teams, Applications (service accounts and integrated systems), and Data Products (another product consuming through a governed dependency). A healthy mix often includes all four: people exploring and analyzing, apps running in production, and products composing upstream assets.
- Approved requests: total approved access requests, a baseline count of formal consumption events.
- Providers: distinct data products with at least one consumer. This is narrower than “products in the catalog”; it is the subset that has crossed from listed to actively consumed.
- Active domains: domains containing at least one active provider. Compare this to total domains publishing products to see whether consumption is concentrated in a few areas or spread across the portfolio.
Use domain filters to restrict the view to a single domain when a domain lead reviews local supply vs demand.
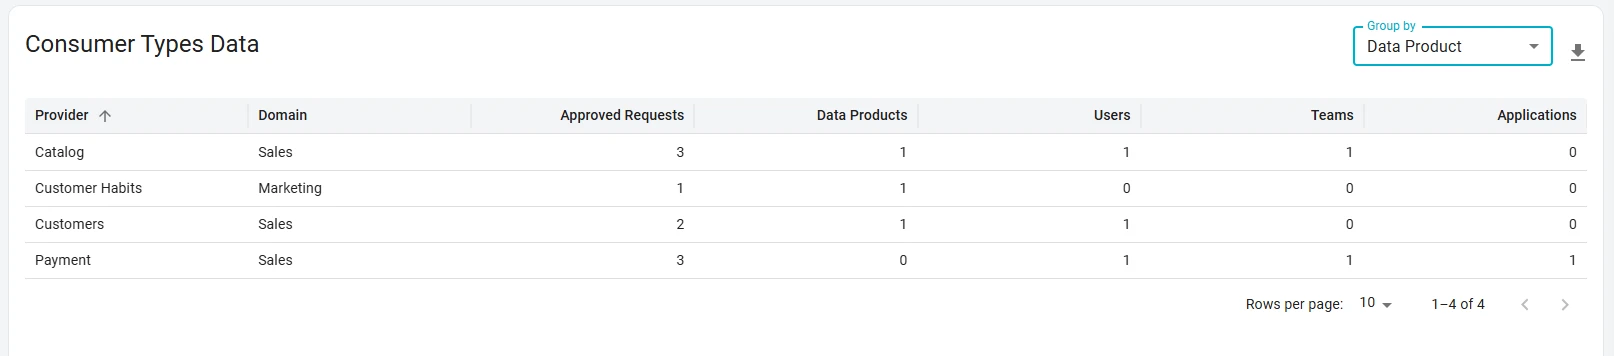
The table below the summary breaks consumers down by provider (default) or by domain (grouped view). Per provider, you see how many consumers fall into each type. Grouping by domain reveals whether a domain publishes many products but only a few attract consumers, or whether consumption is evenly distributed across its catalog.
Reading consumption by pattern:
| Pattern | What you may see | What it suggests |
|---|---|---|
| Active storefront | High providers count relative to published products; diverse consumer types | Products are discoverable, trusted, and consumed through the marketplace |
| People-heavy | Users and Teams dominate; few Applications or Data Products | Strong analyst adoption; consider whether production pipelines should route through governed access |
| Pipeline-heavy | Applications or Data Products dominate; few individual Users | Consumption is embedded in systems; validate documentation and SLAs for machine consumers |
| Provider concentration | Few products hold most consumers | Clear winners; invest in those owners’ capacity and upstream stability |
| Domain with no active providers | Products published, zero marketplace consumers | Possible shelfware, permission bypass, or discovery gap; cross-check fill rate and engagement |
Typical workflows:
- A data product owner opens the per-provider table to see who consumes their product and in what form (user vs application vs downstream product). That feedback loop is what turns custodians into product managers (The Data Marketplace).
- A domain lead groups by domain and compares published products vs active providers: is the domain producing assets people request, or only assets that exist in the catalog?
- A governance team reviews consumer mix and approved requests as a macro success metric for the data program, and uses domain filters to spot uneven adoption before rolling out new policies portfolio-wide.
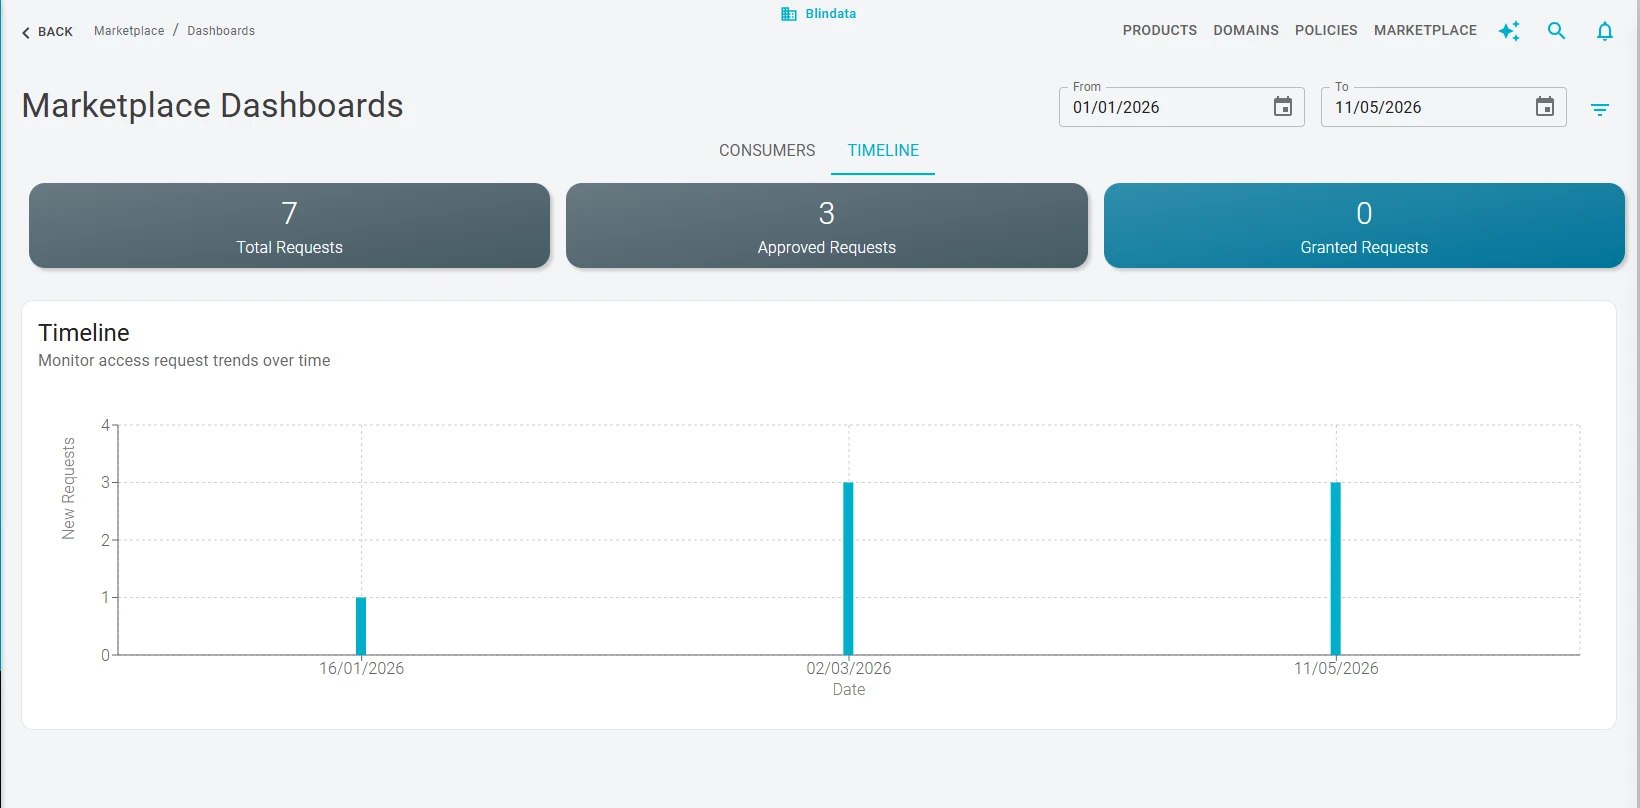
Timeline tab: is the request funnel healthy?
The Timeline tab tracks when requests are submitted and how they progress. Set From and To to define the analysis window, then review:
- Total requests: new access requests submitted for approval in the period.
- Approved requests: requests submitted in the period that have been approved.
- Granted requests: requests submitted in the period that have been granted (access actually provisioned).
A daily bar chart shows new submissions per day, useful for spotting launch spikes, seasonal demand, or stagnation after an initial rollout.
Funnel signals:
| Signal | What to investigate |
|---|---|
| High submissions, low approvals | Approval bottlenecks, unclear use-case requirements, or products not meeting consumer expectations |
| High approvals, low grants | Provisioning or integration gaps between marketplace decision and technical access |
| Flat submissions after launch | Discoverability, engagement, or trust problems; pair with user engagement and fill rate |
| Rising grants without rising dependents | Direct consumption growing faster than composable reuse; not always bad, but worth comparing to portfolio reuse |
Structured access requests capture why data is needed, not only who asked. That context is what traditional ticketing loses and what makes marketplace metrics actionable for compliance and product improvement.
When structural and marketplace metrics diverge
Read portfolio reuse and marketplace adoption together before major portfolio decisions. Structural dependencies are design-time; marketplace activity is runtime. Divergence is often informative, not an error.
| Pattern | Structural deps | Marketplace activity | Likely interpretation | Action |
|---|---|---|---|---|
| Hidden hub | High external-domain count | Moderate requests | Access may flow through pipelines not reflected in marketplace | Validate port contracts and publishing |
| Popular but isolated | Low dependents | High approved/granted requests | Direct consumption without composable downstream products | Invest in documentation and SLA |
| Shelfware | Zero dependents | Zero requests | Registered but neither composed nor consumed | Review ownership, fill rate, visibility |
| Compose-only | High same-domain count | Low cross-domain requests | Internal reuse working; limited enterprise reach | Decide if cross-domain promotion is needed |
| Requested but not composed | Low dependents | Rising grants | Consumers access data without declaring input ports | Encourage port declarations in descriptors for impact visibility |
Leading indicators (linking, ownership, fill rate) prepare products for adoption. Lagging marketplace metrics confirm whether that preparation translates into governed consumption. When they disagree, the gap usually points to a specific lever: metadata quality, discoverability, approval friction, or missing composability declarations.
User engagement
Metadata quality and portfolio structure mean little if only the central governance team uses the platform. The User Engagement Dashboard tracks whether Blindata is embedded in daily workflows, and among which audiences.
Sessions show usage frequency over time: whether Blindata is a primary tool or an occasional audit interface. Low session counts after a catalog import may indicate a supply problem; rising sessions after a marketplace launch suggest demand-side traction.
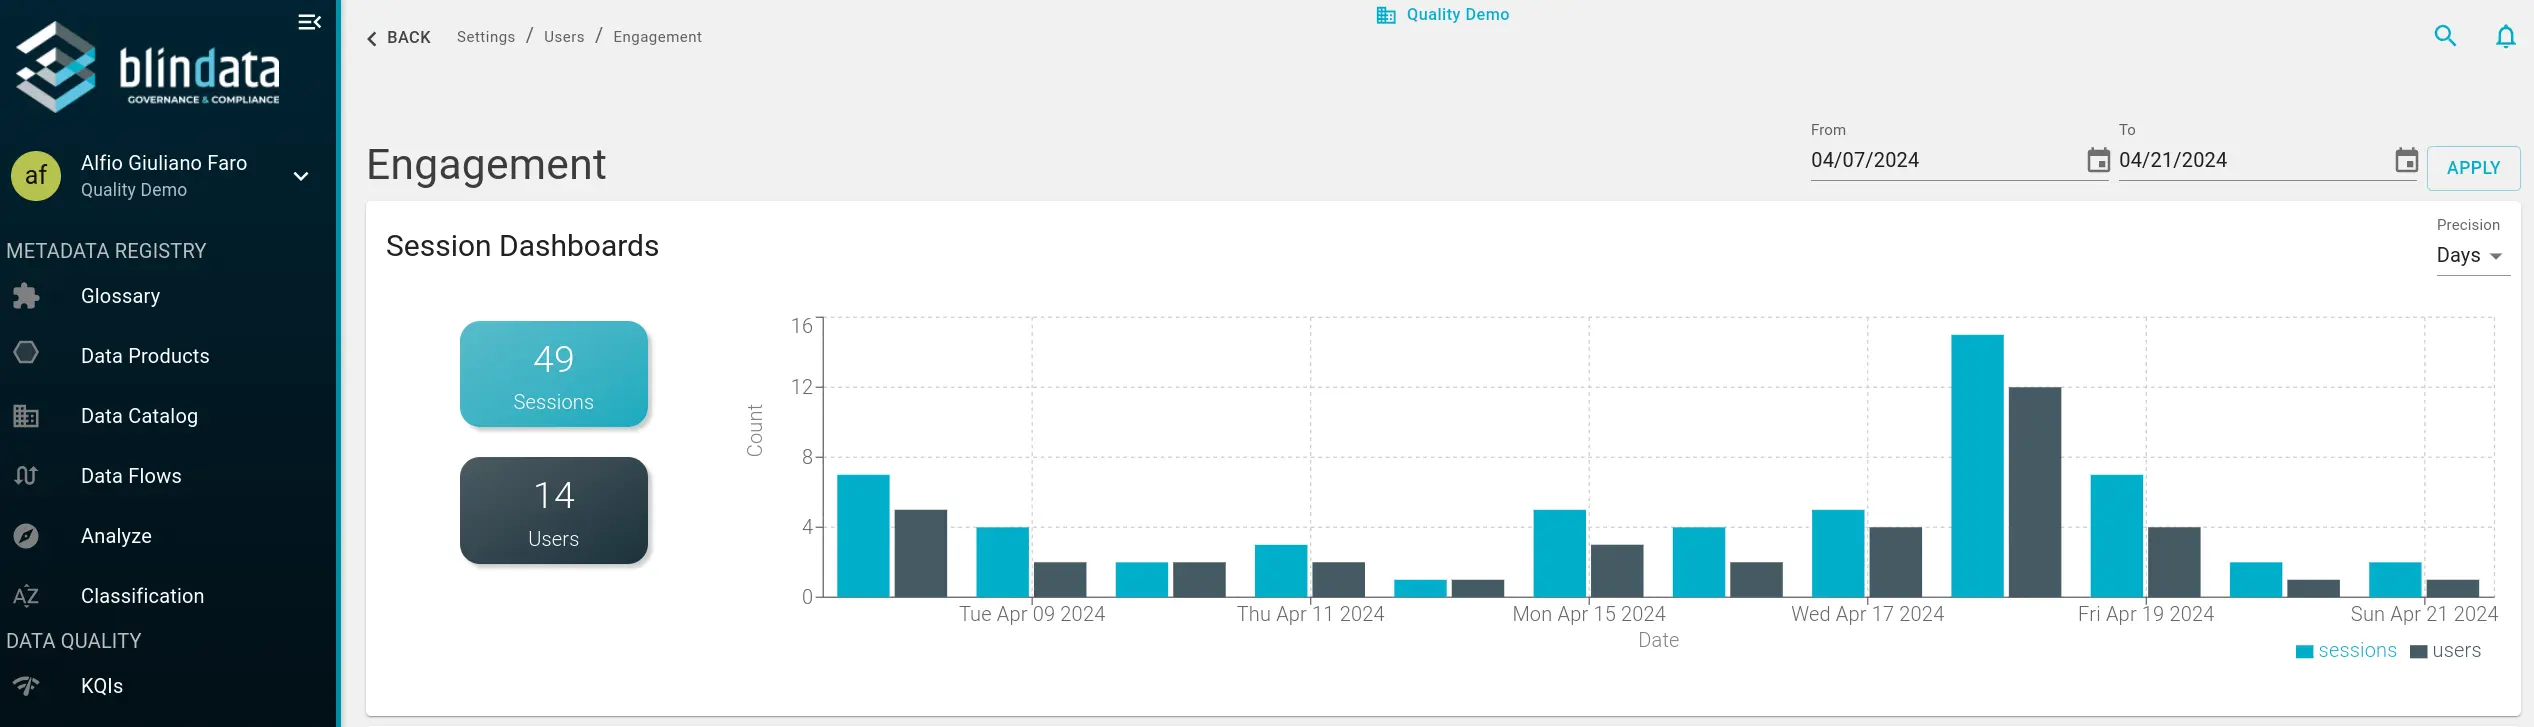
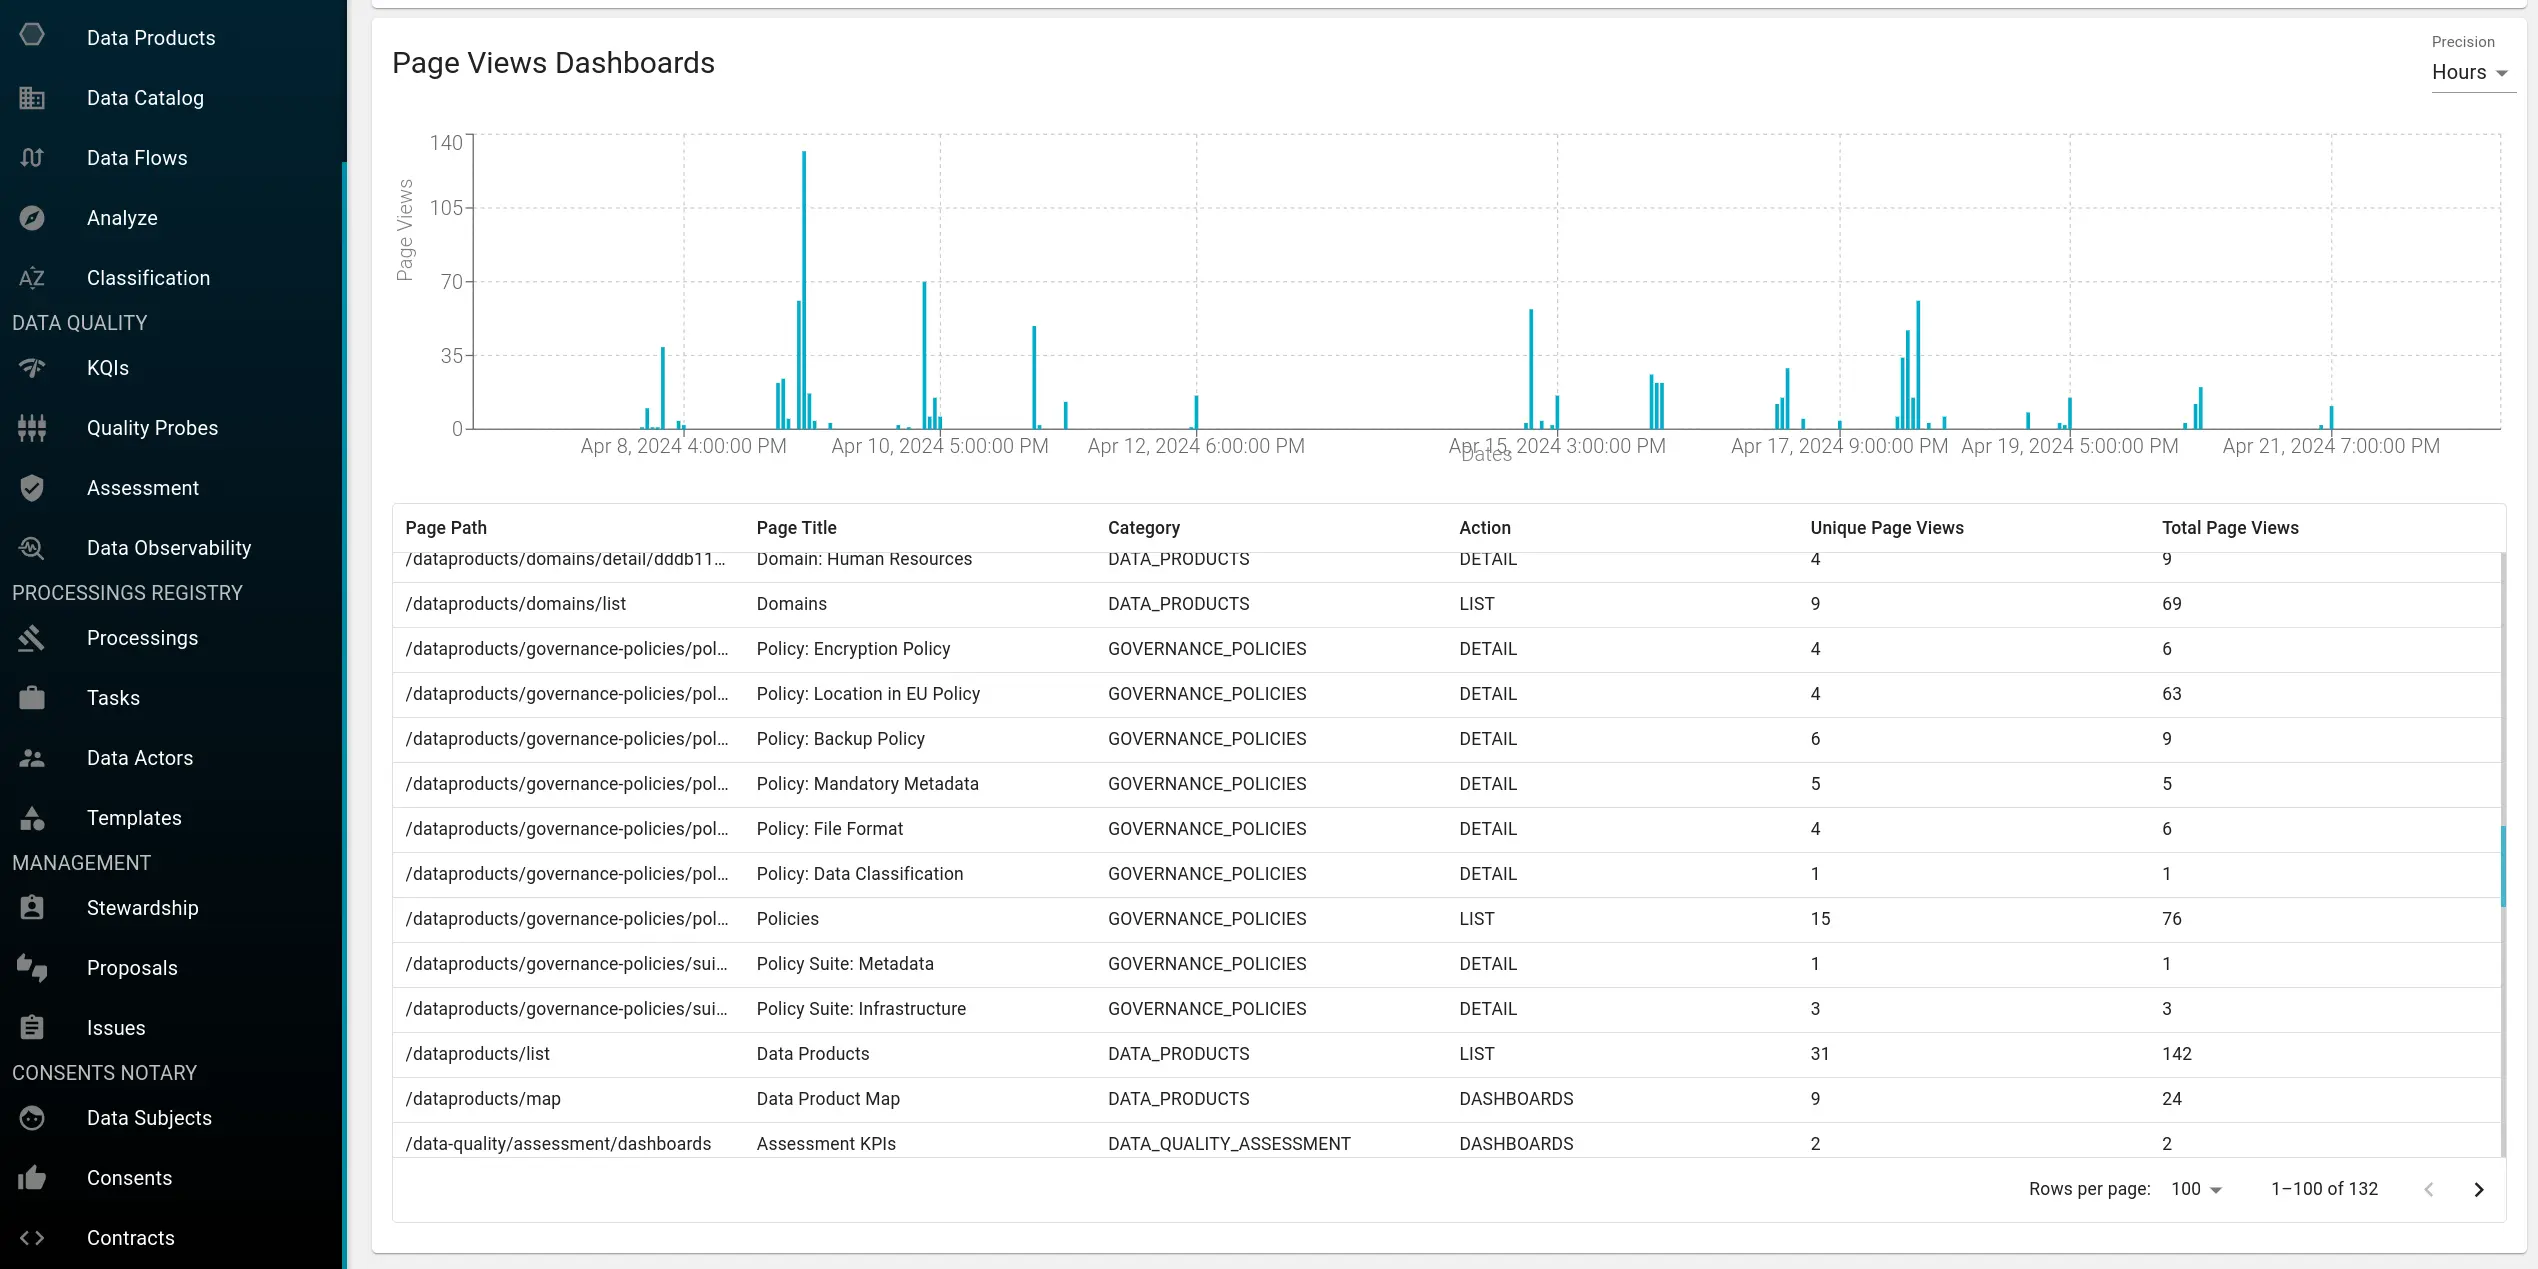
Page views break activity by path, category, and action type (LIST, DETAIL, DASHBOARD). High LIST views with low DETAIL views suggest users browse but do not drill in; growing DASHBOARD views among domain leads suggest governance metrics are entering operational cadence.
Segment by audience: login activity is tracked per user. Combined with custom properties on users (User type as Business vs Technical, Department, Domain affiliation), you can distinguish business analysts from engineering stewards and separate application users from interactive human traffic.
Cross-metric check: if linking and fill rate improve but business-user page views stay flat, the problem is likely discoverability or permissioning. If engagement is high but fill rate is low, users are arriving at incomplete assets.
Conducting periodic assessments
Governance monitoring is effective only when you conduct periodic assessments of your success metrics, rather than treating them as a one-off project deliverable.
Review cadence by audience:
| Audience | Cadence | Primary dashboards | Decisions enabled |
|---|---|---|---|
| Domain stewards | Monthly | Glossary/Data Product fill rate, business term linking, responsibilities | Sprint backlogs, linking campaigns, ownership fixes |
| Data product owners | Monthly | Fill rate, downstream dependencies, marketplace per-product table | Pre-change impact analysis, documentation gaps |
| Governance leads | Monthly / quarterly | All dimensions; cross-domain comparison; engagement by segment | Program prioritization, investment cases, domain scorecards |
| Leadership | Quarterly | Downstream treemap, marketplace timeline, maturity trends | Portfolio strategy, hub investment, domain boundary review |
Baseline, target, export, re-measure: every Blindata success metrics dashboard supports CSV export, filtering, and column customization. Export all dimensions in month zero; set domain-specific targets (not one enterprise number); assign remediation lists to owners; report trend, not point-in-time status alone.
Where to start depends on program pain:
| Program pain | Start here | Then add |
|---|---|---|
| “Nobody trusts the catalog” | Metadata fill rate (documentation + descriptions) | User engagement page paths |
| “Glossary project stalled” | Business term linking from glossary side, attribute granularity | Ownership and role coverage |
| “Products break downstream teams” | Downstream dependencies before any schema change | Marketplace timeline for consumer notification |
| “Marketplace unused” | Engagement segmentation by business users | Fill rate on marketplace-published products |
| “Stewards overwhelmed” | Responsibilities workload table | Role completeness vs generic coverage |
Conclusion
Monitoring data governance, the catalog, and your data product portfolio is not about collecting metrics for a steering deck. It is about making meaning, ownership, completeness, architectural impact, consumption, and habit visible, so improvement is deliberate rather than reactive.
Blindata’s success metrics dashboards for the Business Glossary and Data Products, together with Marketplace and User Engagement views, implement this framework in practice. The dashboards introduced in the June 2026 platform update were built precisely so governance leads and product owners can shift from anecdote to evidence: baseline your portfolio, set targets per dimension, export remediation lists, and review on a cadence until maturity becomes a habit, not a one-off cleanup.
Define what “good” means for your organization. Measure it consistently. Invest where leading and lagging indicators disagree. That is how a catalog becomes trustworthy, a glossary becomes operational, and a data product portfolio becomes an asset the enterprise actually reuses.