Overview
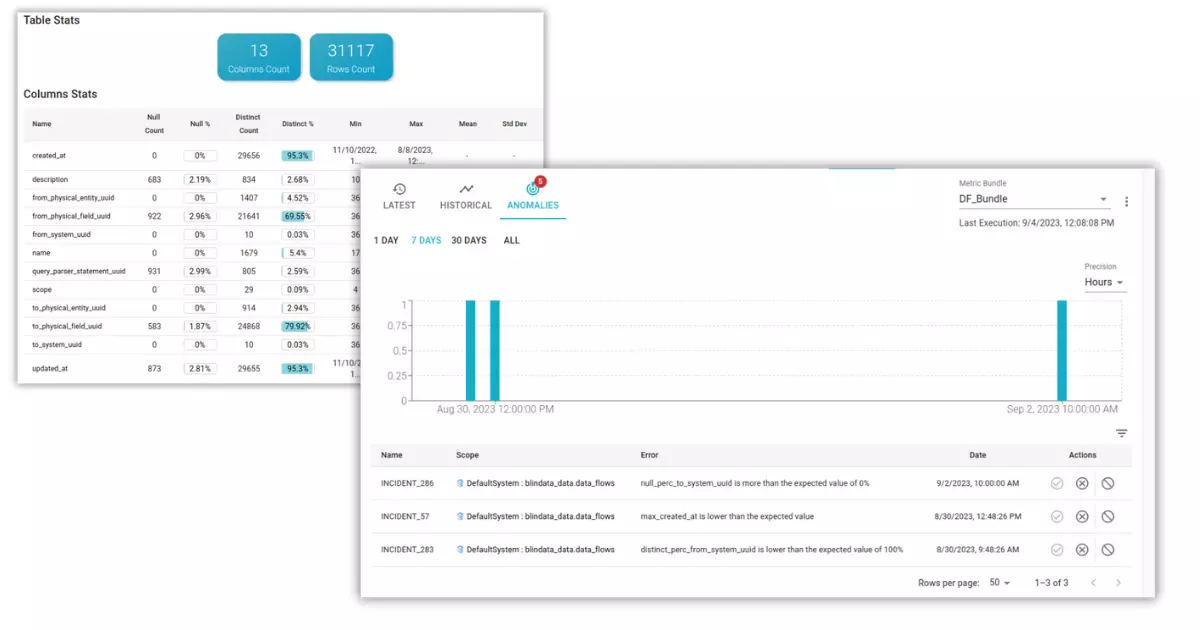
Data profiling serves as a potent tool for visualizing and analyzing the structure and characteristics of our data. When data profiling evolves into a continuous and automated practice, it not only becomes a valuable resource for data exploration but also emerges as a powerful instrument for gaining insights into the health of our data. This assessment extends beyond the technical aspects of data pipeline feeding, encompassing business-related considerations tied to data collection processes and broader data quality concerns.
Within this article, we will delve into the practical applications of data profiling as a means to track trends, monitor data ingestion processes, and maintain overall vigilance over the well-being of our data assets.

In the context of data quality frameworks, data control often involves the establishment of rules, either manually defined or automatically generated through data profiling analyses. This undertaking can be resource-intensive and does not always ensure comprehensive coverage to guard against unforeseen events. Moreover, establishing predefined acceptable thresholds for these controls can prove challenging, resulting in rules that are too lenient and not in tune with real-world data dynamics. Continuous monitoring and anomaly detection, on the other hand, are designed to proactively avert unexpected incidents and expedite data quality initiatives.
Expectations
From a data quality perspective, we hold certain expectations based on established data quality criteria:
Timeliness
Detect late arriving data and identify data drift. Train model to recognize patterns, such as seasonality.
Completeness
Measure the percentage of missing data, and consistency with historical patterns.
Duplicates
Identify duplicate data, preventing technical errors from from impacting the decision-making processes.
Reliability
Ensure that data volumes and data consistency conform to predefined and accepted service levels as well as established trends.
Validity
Detect data drift and precision - referential integrity, data formats etc. This usually is detected through user-provided rules or proxy metrics that gauge alignment with the underlying business logic.
Reliability of Data Pipelines
Monitoring the reliability of data pipelines involves maintaining control over the data feeding processes in terms of volumes, timeliness, and data freshness. There are two key profiling metrics that serve this purpose:
- Volume Counts - This metric allows you to keep track of dataset growth and detect anomalies due to missing uploads, as well as unusual trends of growth or decline.
- Mean, Range, and Distribution of Dates - These metrics enable you to monitor data freshness, timeliness and, consequently, adherence to its expected Service Level Agreements (SLAs).
Data Duplication and Uniqueness
Analyzing and monitoring the presence of potential duplicates caused by technical issues is a foundational practice in effective data management. This process involves assessing both the absolute and relative occurrences of distinct values within a dataset, at both the individual column level and through aggregations of columns.
The detection of duplicates plays a pivotal role in ensuring data quality. When duplicate data is inadvertently introduced or technical glitches generate redundant entries, it can significantly compromise the accuracy and dependability of analyses and decisions based on such data.
This monitoring not only aids in identifying and rectifying potential inconsistencies but also has the potential to unveil concealed trends and anomalies. The ability to promptly identify and address these issues serves as a proactive measure against deteriorating data quality, guaranteeing that the information derived from such data remains dependable and suitable for supporting critical business decisions.
Data Completeness
To measure data completeness, profiling metrics related to the percentages and counts of null values, as well as the count of empty strings, prove to be valuable.
It’s not mandatory for an attribute to always contain a value, but monitoring the evolution of these metrics over time can reveal potential deteriorations in the data collection process. These changes might be linked to variations in the phenomenon under data collection or technical errors in upstream systems. Proactively understanding such situations allows for timely intervention and correction before the issue can cause actual harm.
Data Distributions and Ranges
Statistical metrics, including measures like minimum, maximum, mean, and variance, offer valuable insights into data patterns and can highlight potential problems within acceptable value ranges. For instance, observing the minimum and maximum dates for contract signings, calculating the daily average of total revenue from receipts, or determining the minimum and maximum length of strings referencing specific codes are all examples of how statistical metrics can provide insights into the validity, freshness, accuracy, and trends associated with the data.
Data Validity
Ensuring data validity involves a multifaceted approach that includes various aspects, among which are:
-
Formats and standards - Assessing statistics related to string lengths and numeric value intervals serves as a robust method for detecting errors or deviations from established standards.
-
Temporal Integrity - By examining statistics concerning date-type attributes, such as minimum, maximum, and mean values, we not only ascertain permissible ranges but also verify the correct temporal sequencing of data.
-
Domain Specific Validations - In situations where anticipated values cannot be predefined, the creation of custom metrics for monitoring becomes necessary. Conversely, when expected values can be established in advance, it’s advisable to define and formalize them within a comprehensive quality suite.
Conclusion
Utilizing these data profiling metrics can assist in identifying potential data issues and instilling confidence in the reliability of your dataset for analytical and decision-making needs. These metrics can be employed as standalone assessments and through continuous monitoring to consistently maintain data quality and validity over time. Blindata’s Data Observability & Anomaly Detection functions have been meticulously designed to fulfill this precise purpose.
