Overview
Blindata’s approach to data quality is centered around defining Key Quality Indicators (KQIs). KQIs are specific metrics that reflect the overall quality of your data and the impact it has on your business.
By leveraging Blindata Data Quality module’s features, you can gain insights into the areas of your data that matter most to your organization and objectively measure their performance over time. This information enables you to make informed, data-driven decisions that enhance your data quality and ultimately drive your business success forward.
Define Your KQIs
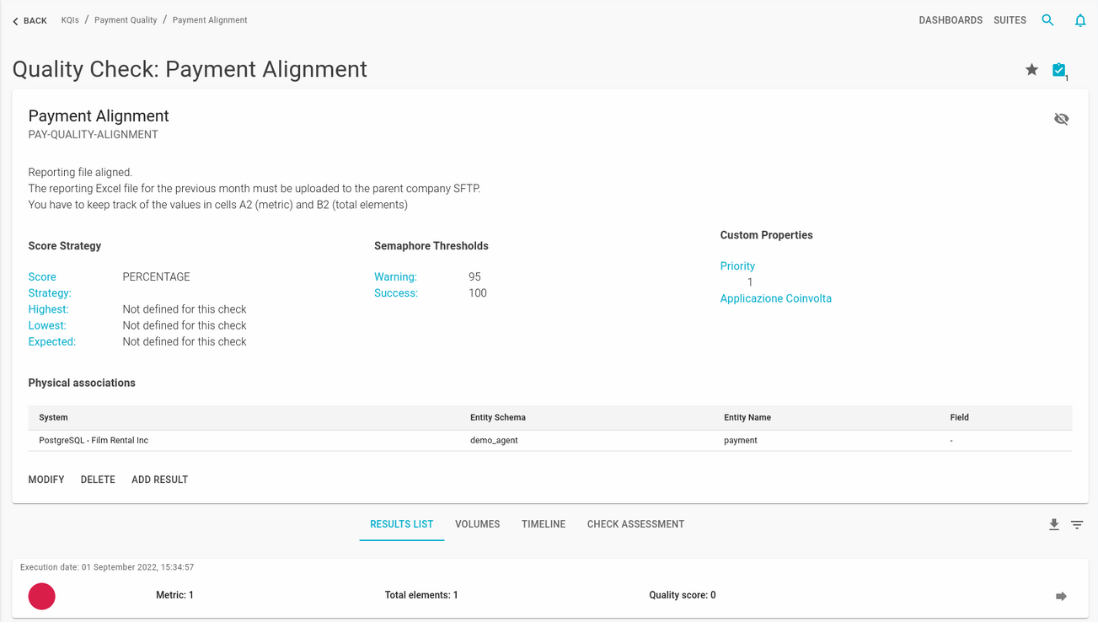
Write functional specifications for your KQI, then identify and define metric, thresholds, scoring strategies, and alerts.
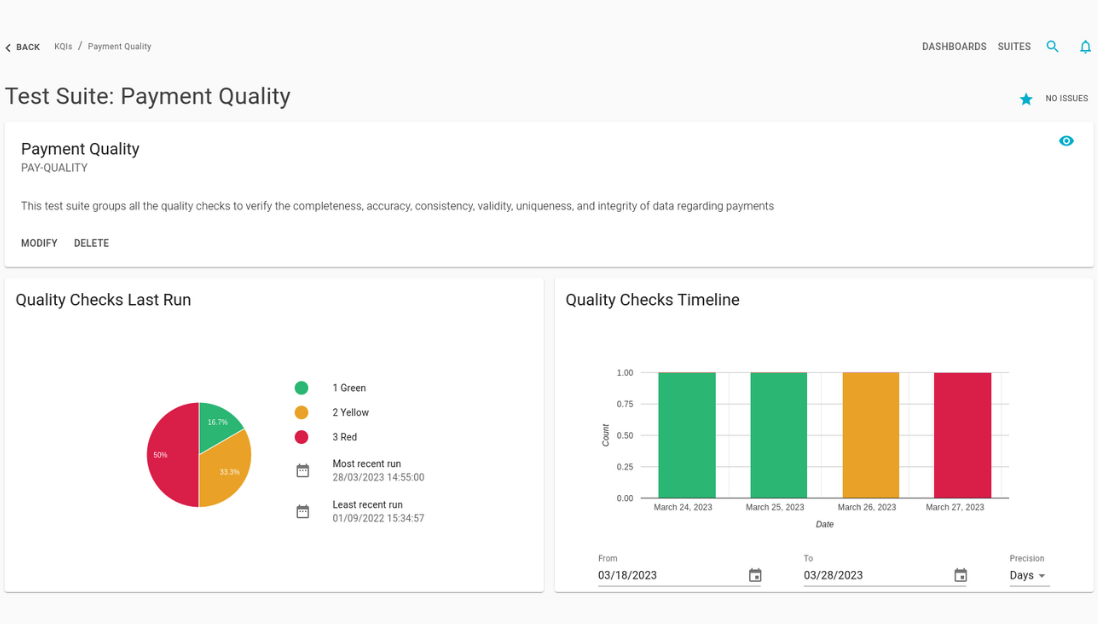
Keep Them Organized
Collect your KQIs into suites. A suite consists of a set of logically related KQIs, such as KQIs that refer to a specific dataset.
Gather Metrics
Gather quality metrics in the way that is most effective to you. Take advantage of Blindata Agent, open APIs, and import functionalities or manually collect the metrics through our intuitive interface.
Monitor Data Quality
Monitor quality metrics and their trends. Take advantage of Blindata extended dashboarding and subscription features to receive notifications related to significant results.
Features
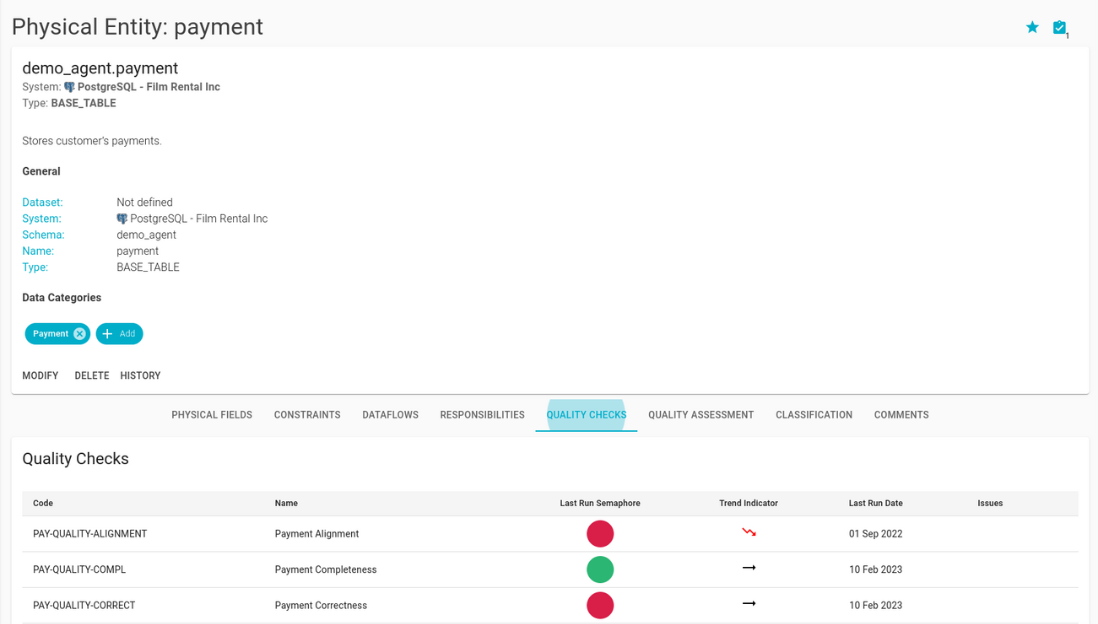
The Data Quality module’s core features include the ability to define, calculate, and monitor KQIs.
But that’s not all. Data Quality module also integrates seamlessly with other ones, such as the Business Glossary, Data Catalog, and Issue Management. With the Business Glossary and Data Catalog integration, you can associate KQIs with your data assets, allowing you to easily understand the quality of the data you need at a glance. Additionally, the Issue Management integration enables you to create maintenance workflows, and manage remediation activities in an organized manner.
With Blindata Data Quality module, you have access to all the basic features you need to manage and monitor data quality, plus additional features that allow for a more integrated and comprehensive approach to data quality management.
How to
Our Data Quality module offers a simple and effective way to define KQIs:
Gather quality metrics in the way that is most effective to you.
- Blindata Agent: Blindata Agent can be used to define and execute checks quickly and easily through the Blindata interface.
- Open APIs: The module supports integration with existing data flows and processes through open and documented APIs.
- Import: Results from automated or non-automated data quality checks can be imported into Blindata.
- Manual collection: Data quality metrics can be collected manually through the Blindata interface, such as for controls that cannot be automated due to their complexity.