A deep dive into how to apply data quality dimensions to measure and improve your data’s trustworthiness and business value.
In today’s data-driven world, making informed decisions relies heavily on the quality of your data. But how can you be sure that your data is fit for its intended purpose? This is where data quality dimensions come into play. This article will explore the core data quality dimensions, how to select the relevant ones for your needs, define indicators to measure them, and establish a process for ongoing monitoring and improvement.
Overview: The Foundation of Trustworthy Data
The dimensions of data quality serve as a vital qualitative tool for assessing the health of your data. While various publications propose numerous factors, a general consensus has formed around a core set. The DAMA (Data Management Association) framework, for instance, identifies six universally applicable core dimensions.
However, the landscape of data quality is vast, with some studies listing over 60 different dimensions. This highlights a crucial point: there is no one-size-fits-all solution or “magic formula” for data quality. The selection and application of these dimensions must be tailored not only to the technical environment but, more importantly, to the specific business context. Factors such as data usage requirements, processing goals, and associated risk levels all play a role in determining the most appropriate dimensions and their acceptance criteria.
The six core data quality dimensions that provide a solid foundation for any data quality initiative are:
- Accuracy: How well does the data reflect the real world?
- Completeness: Is all the necessary data present?
- Consistency: Does the data remain uniform and coherent across different systems?
- Uniqueness: Is each piece of data a single, distinct entry?
- Timeliness: Is the data available when it’s needed?
- Validity: Does the data conform to the required format and business rules?
These dimensions are the bedrock of ensuring your data is a reliable asset for your organization.
The Six Core Data Quality Dimensions Explained
This dimension measures how closely your data represents the real-world events or objects it is intended to describe. Inaccurate data can lead to flawed insights and poor business decisions.
Data accuracy can be assessed by comparing data values against verifiable sources or through physical observation. Another method involves comparing values to established standards or reference data from a reliable source. The accuracy of data is often a direct reflection of the robustness of the data gathering and validation processes in place.
Completeness refers to the extent to which all required information is present in a dataset. It’s about ensuring there are no gaps or missing values that could lead to an incomplete picture and flawed conclusions.
Properly measuring completeness can be challenging as it requires understanding the business impact of missing information. For instance, a missing product description on an e-commerce site has a direct customer-facing impact and should be prioritized over other less critical missing data points. This underscores the principle that data quality must always be considered within the context of its use.
This dimension evaluates the uniformity and reliability of data across various systems and within a single dataset. It ensures that data is free from contradictions and that the same information stored in multiple locations is identical.
Measuring consistency can involve checks within the same system or comparisons of datasets across different technologies. It often touches on infrastructural considerations, such as the alignment between different systems. This can include verifying the overall consistency of two different datasets from both a row-level and a dataset-level perspective.
Uniqueness ensures that there are no duplicate or redundant records in your dataset. Each entity or event should be represented only once to avoid confusion, errors, and wasted resources.
Duplicates can stem from various sources and have different impacts. Technical issues in data pipelines, such as incorrect joins or faulty transformations, can create duplicates that affect data consistency and lead to skewed analysis. For example, a duplicated customer record could inflate sales figures.
Duplicates can also arise from business processes, such as multiple data entry points or a lack of standardized procedures. These can impact the uniqueness and validity of the data, leading to operational inefficiencies. For instance, a customer with multiple records due to different contact details might receive duplicate marketing materials.
Assessing uniqueness involves checking for duplicate records, keys, or identifiers. It’s important to note that a record can be a duplicate even if some fields differ. The rules for identifying duplicates are highly dependent on the business context and the purpose of the data analysis.
This dimension addresses how current and up-to-date your data is. It’s assessed by looking at timestamps, expiration dates, and the frequency of data updates.
While related, timeliness and freshness are distinct concepts. Timeliness refers to whether data is available when it is expected and needed for a process. Freshness, on the other hand, measures how current the data is at the moment of use.
Consider a dataset of daily product sales. For a monthly sales report, timeliness is key; the data needs to be available at the end of the month. However, for managing inventory, freshness is paramount; the data must reflect the current stock levels as accurately as possible.
Both are crucial aspects of data quality, but they have different implications depending on the context of data usage. Clear communication of requirements between data users and providers is essential.
Validity measures how well data conforms to predefined standards, rules, or constraints. This ensures the data is reliable, consistent, and accurate.
It can be assessed by checking for correct data types, formats, ranges, or patterns. For instance, an email address should follow a standard format, and a date of birth should fall within a logical range. The business glossary is an essential tool for defining these business rules, ranges, and patterns to enforce data validity.
Beyond the Core: Other Important Dimensions
While the six core dimensions are widely accepted, they are not exhaustive. The world of data is nuanced, and specific contexts demand a more granular approach. Depending on the specific context, other dimensions such as currency, conformity, and integrity may be relevant. These can relate to governance, infrastructure, and other organizational aspects. The ultimate selection of dimensions and their acceptance criteria should always be driven by the requirements and goals of the data’s use.
Let’s explore some of these additional dimensions:
-
Currency: Not to be confused with timeliness, currency refers to the degree to which data is up-to-date with the real world it represents. For example, a customer’s address is timely if it arrives when needed for a mailing, but it lacks currency if the customer moved six months ago and the database wasn’t updated. For businesses that rely on real-time information, like logistics or finance, currency is a critical dimension.
-
Conformity: This dimension measures whether your data adheres to a set of standard definitions, such as data type, size, and format. For instance, if a date field is required to be in the “YYYY-MM-DD” format, any entry like “MM/DD/YYYY” would violate the conformity dimension. This is especially important for data integration and ensuring that automated processes run smoothly.
-
Integrity (Referential Integrity): Data integrity ensures that relationships between data elements are maintained and remain intact as data moves across different systems. It ensures that all data can be traced and connected. For example, in a sales database, every order record should link to a valid customer record. An “orphan” order without a corresponding customer would be a breach of data integrity.
These dimensions are not merely technical checks; they are deeply intertwined with broader organizational functions. Data governance, for example, is the framework of rules, roles, and processes that dictates how data is managed. Dimensions like conformity and integrity are direct reflections of a strong governance program. When data conforms to set standards and its relationships are preserved, it’s a sign that governance policies are being effectively implemented.
Similarly, an organization’s infrastructure—the hardware, software, and networks that support data flow—plays a crucial role. A robust infrastructure is necessary to ensure data is captured, stored, and processed in a way that maintains its quality across all dimensions. For example, ensuring data currency might require an infrastructure capable of handling real-time data streams and updates. Data quality controls must be put in place considering also the technical capabilities of the underlying data platform.
Ultimately, the goal is not to measure every possible dimension but to select the ones that have the most significant impact on your business objectives. By carefully choosing and monitoring the right data quality dimensions, you can build a foundation of trustworthy data that drives better decisions and creates real business value.
A Practical Framework for Data Quality Management
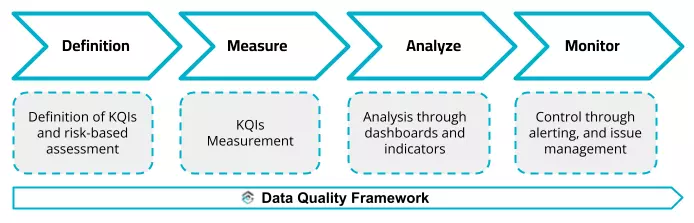
The principles of data quality dimensions can be effectively applied through a structured data quality management process. A typical approach involves the following steps:
- Identify Critical Data: Pinpoint the data that is most crucial for your business operations and reporting.
- Define Dimensions and Thresholds: Select the relevant data quality dimensions and establish acceptable quality thresholds.
- Measure and Analyze: Measure the data against the chosen dimensions and analyze the results.
- Review and Remediate: Review the findings and implement corrective actions to address any issues.
- Monitor and Iterate: Continuously monitor data quality trends and repeat the process, extending it to other data assets as needed.
The success of this process hinges on ensuring that the defined data quality rules accurately reflect the requirements of your specific business activities.
Defining and Measuring Key Quality Indicators (KQIs)
A robust data quality strategy is built on the definition, measurement, and active monitoring of Key Quality Indicators (KQIs). Tools like Blindata’s Data Quality module provide a framework for this process, conceptually dividing the work between two key roles:
- The Data Quality Analyst: This functional role is responsible for identifying and defining the necessary KQIs, taking into account business needs.
- The Data Quality Technician: This technical role understands the organization’s systems and data flows and is responsible for implementing the queries and processes to measure the defined KQIs.
By integrating with tools like a Business Glossary and Data Catalog, the results of these KQI measurements can be shared throughout the organization, fostering a culture of data quality.
In this framework, KQIs are measured by calculating a metric that represents a specific quality dimension for a particular dataset. For example:
- Freshness: The number of events collected per hour.
- Completeness: The number of records with a specific field left blank.
- Consistency: The number of instances where a calculated field does not match the values of its source fields.
- Consistency (Infrastructural): The row count comparison between two datasets in different systems.
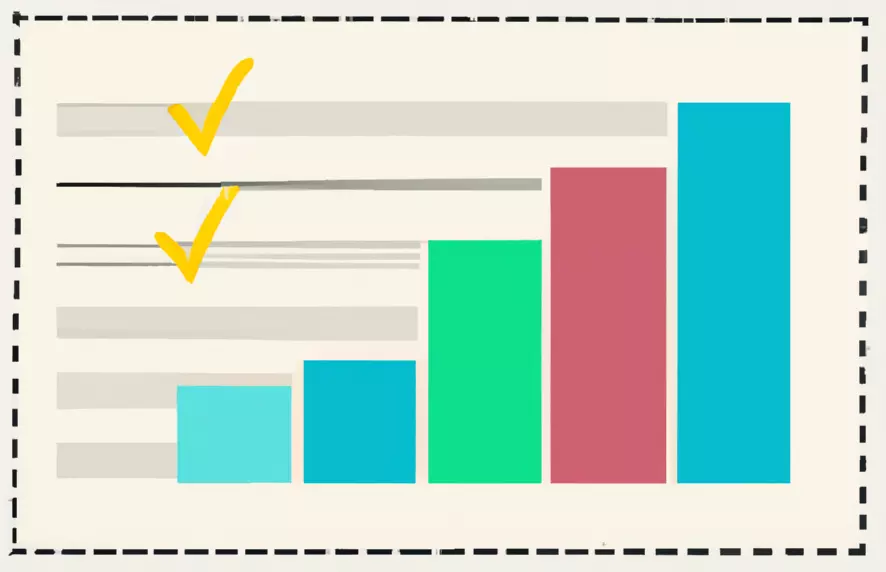
From these metrics, a synthetic score (typically from 0 to 100) is calculated to represent the “goodness” of the KQI against an expected value. This score can then be used to trigger a “traffic light” system (red, yellow, green) based on user-defined thresholds, providing an at-a-glance view of data quality.
Flexible Methods for Gathering Metrics
A flexible approach to gathering data quality metrics is essential to accommodate different scenarios and levels of organizational maturity:
- Manual Collection: For complex or infrequent checks, such as those related to regulatory compliance, metrics can be collected manually through a user interface.
- API Integration: If your organization already has data quality checks and processes in place, the results can be exported to a central platform via API.
- Automated Probes: For organizations starting their data quality journey from scratch, the entire process of metric collection can be automated using quality probes that directly query data sources.