
Overview
With the increasing complexity of data stacks and the sheer volume, velocity, and variety of data generated and collected, data observability has become a necessity for businesses to proactively identify and address data issues, ensuring accuracy and reliability. One of the key aspects of data observability is data profiling, because it provides insights into the contents and shape of data, which is essential for monitoring and analyzing data health.
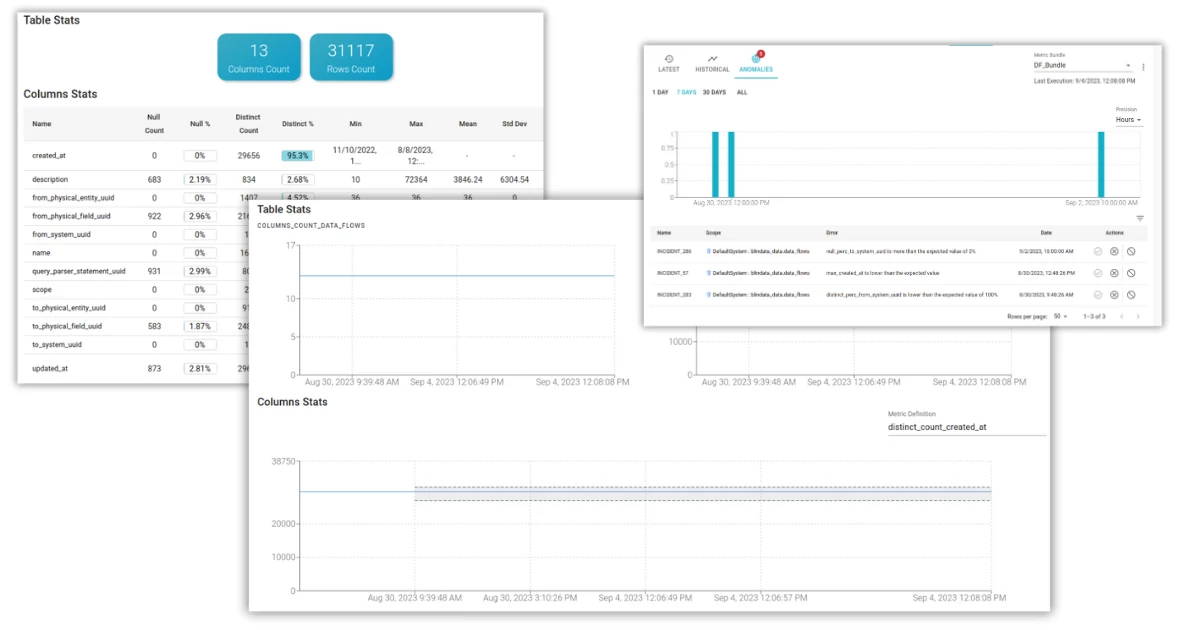
Blindata’s profiling offers a framework for deploying an effective SQL based profiling, made of default or custom metrics that perfectly fit to every scenario. Each profiling metric stores historical data through automated execution, in the form of a time series. This article will explore how Blindata can detect data anomalies through the analysis of the time series generated by its profiling metrics.
What is an anomaly?
In broad terms, an anomaly can be described as “a significant variation from the norm”. Therefore, an anomaly is a data point that diverges from the behavior of a modeled system. To detect anomalies, specific algorithms are used, which depend on both the data structure and their statistical characteristics. In the case of time series, one approach is to use forecasting techniques to estimate the expected values of future data points and then compare them with the actual values to identify any anomalies (i.e., deviations from the expected pattern).
Time Series
Forecasting
Time series forecasting is based on the assumption that the future of a time series is influenced by its past, in other words it is possible to predict the future only if a process is non-random. Fortunately, data profiling metrics derive from processes that can be defined and modeled. But even then, time series forecasting remains a challenging task that requires careful consideration of various factors.
Training Data
Time series can have missing values, which can be due to various reasons such as an error during data profiling. Also, they can be noisy, can contain outliers ( anomalies ) or can have irregular time intervals between data points. Blindata manages all of this thanks to automated data preparation and the massive action features offered to the end user, which allow easy and intuitive exclusion of portions of data from model training.
Model Selection
There are many models to choose from, and they can be distinguished into three main categories.
Choosing one model from these categories requires expertise-level analysis of each time series, a tedious and not scalable task. Blindata removes this burden from the user by applying AutoML techniques: it automatically selects the best forecasting model using genetic programming optimization; then, the chosen model is used to generate the prediction of time series’ future values.
Furthermore, Blindata optimizes the training and forecasting phases, tailoring them to the characteristics of the time series. For instance, if a profiling metric is a constant value, the forecast will be extended, and training will occur less frequently compared to a metric that is highly variable.
Anomaly
Detection
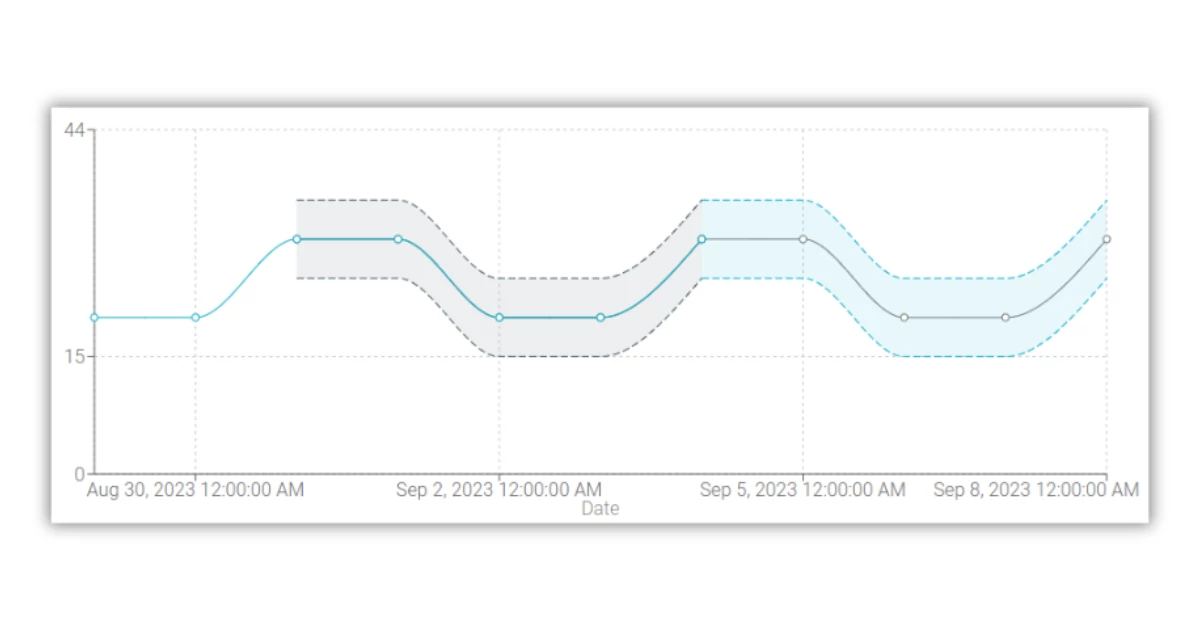
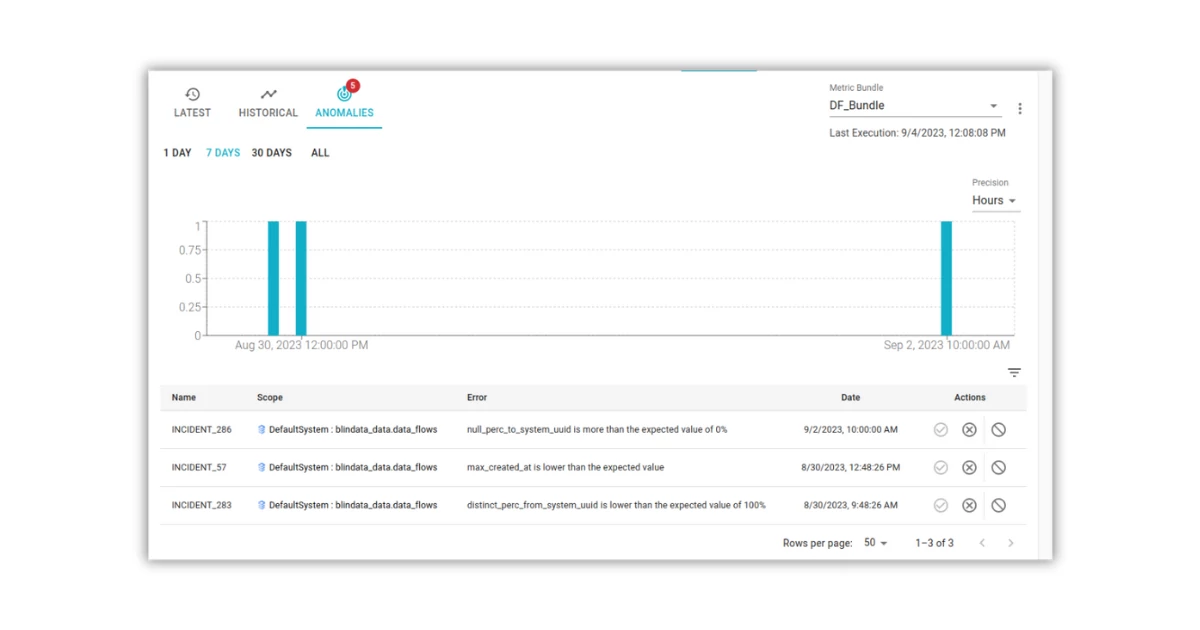
The forecast of a data profiling metric is composed of an estimated value and a range that expresses the uncertainty of the prediction. When a new data point is collected, it is compared against the range of expected values for the metric. If the data point falls outside of the expected range, then it indicates an anomaly that needs to be further investigated.
Conclusion
Blindata’s capabilities for time series forecasting and anomaly detection through automated data profiling provide a powerful and scalable solution for monitoring data quality and health over time. Blindata takes the complexity out by automatically selecting the optimal forecasting model, preprocessing data, and detecting deviations from expected patterns. This allows businesses to more easily monitor their data for anomalies or issues without requiring deep expertise in time series or machine learning.
With Blindata, data observability becomes an effortless process that ensures organizations always have accurate insights into their data and are promptly alerted to any problems, giving them the ability to proactively address data quality issues before they impact key business objectives.