Overview
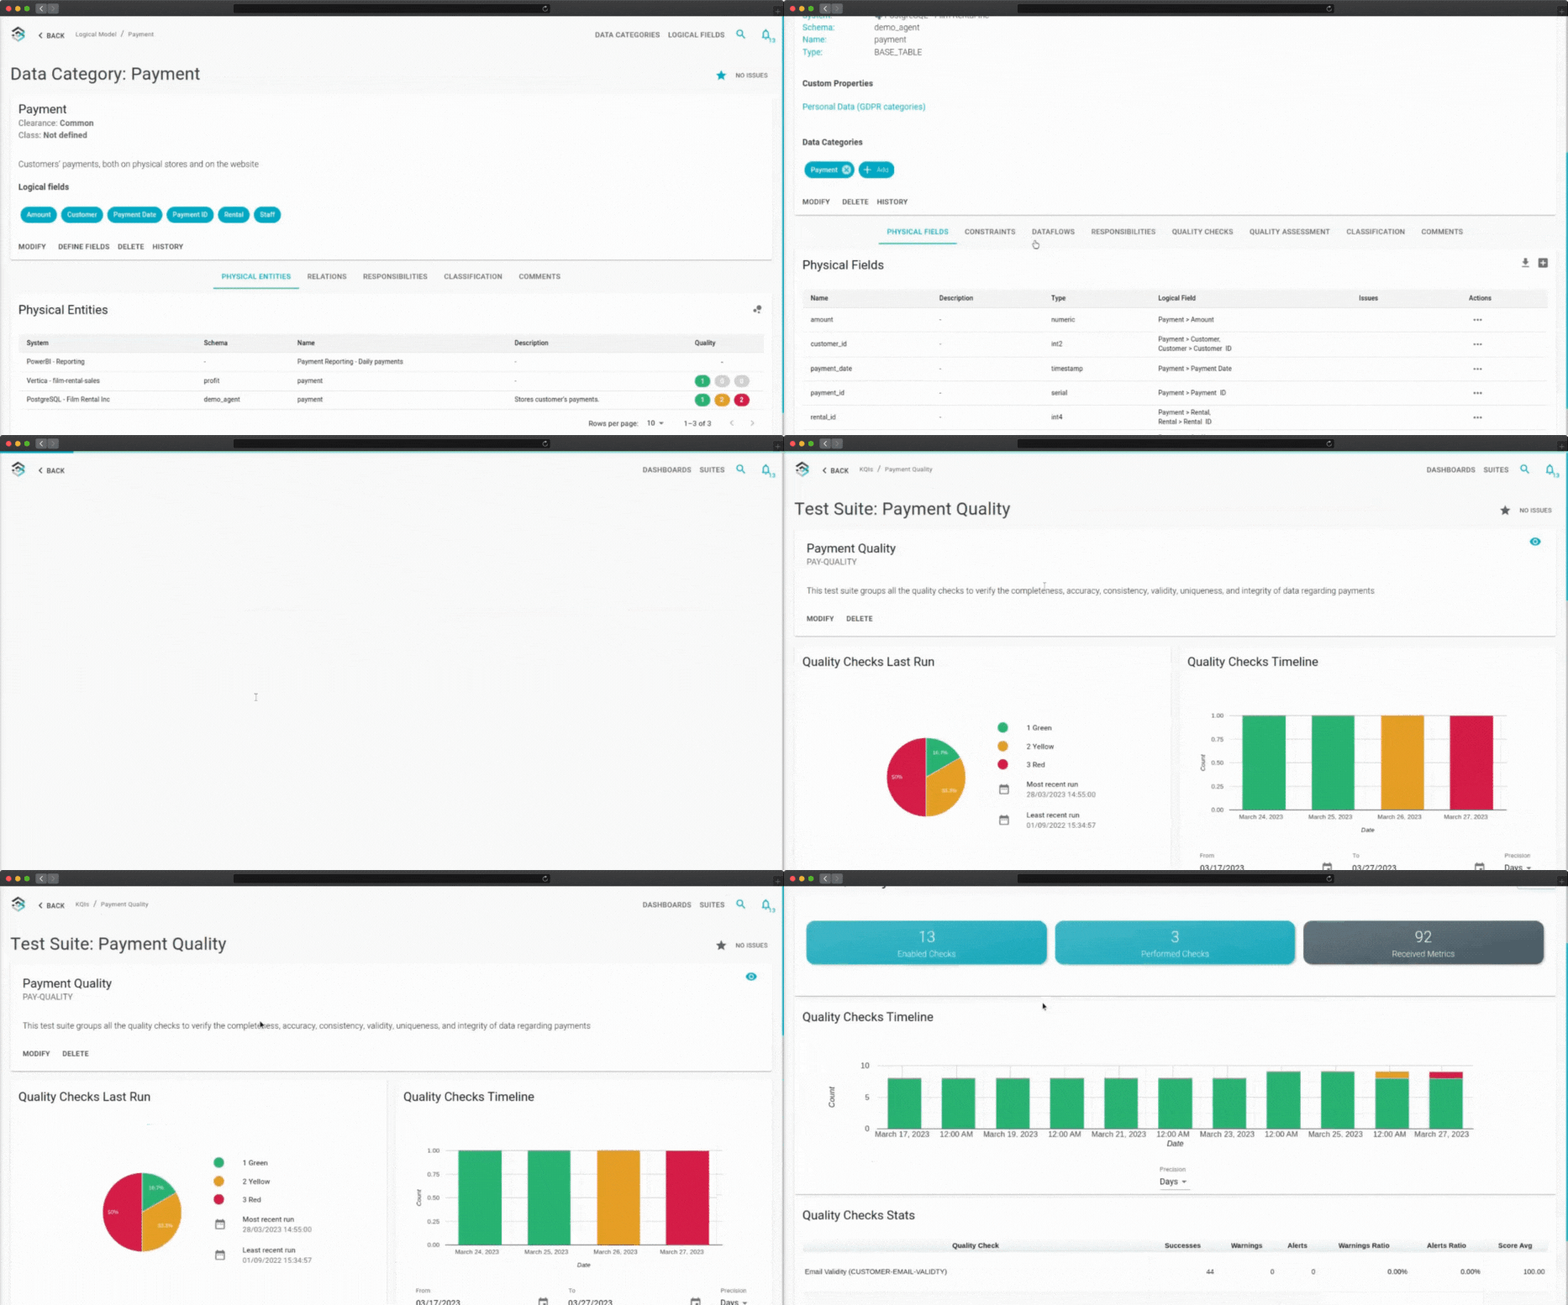
Blindata platform is designed to prioritize a complete high-level overview of your data quality metrics and make data quality information accessible to a broader range of users within your organization. To achieve these goals, we have introduced a range of features, including dashboarding and reporting, integration with Business Glossary and Data Catalog, integration with the Quality Assessment module, integration with the Issue Management module, and notifications.
Features
Blindata’s Data Quality cockpit offers a comprehensive high-level overview of data quality metrics, providing easy access to data quality information. This includes dashboarding and reporting, integration with Business Glossary and Data Catalog, Quality Assessment and Issue Management modules, and notifications. By monitoring critical metrics, verifying data quality controls, and taking prompt action to address issues, users can maintain and improve data quality while promoting appropriate use of data.
The aim of a quality cockpit is to deliver data-driven insights to quickly and efficiently identify and resolve data quality issues. This provides a deeper understanding of data quality and highlights areas for improvement, enabling users to prevent or correct data quality issues before they escalate. Blindata’s quality cockpit features promote the democratization of data quality, giving all users across the organization greater visibility into the quality of data they work with. This fosters data-driven decision-making based on reliable information, which promotes an appropriate use of data.
How to
Blindata Data Quality utilizes a framework that calculates synthetic indicators based on Key Quality Indicators. Once the KQIs have been identified and measured, Blindata calculates two different synthetic indicators that are useful for monitoring data quality:
- Score: The first indicator, the score, is a value ranging from zero to one hundred that measures the quality of a KQI. The score indicates where the KQI value stands in relation to an expected value.
- Traffic Light: The second indicator is the traffic light, which is based on the score and user-defined alert thresholds. The traffic light is an additional synthetic indicator that assigns a color (green, yellow, or red) to each KQI, providing a quick and easy way to identify KQIs that are performing well or not.
The traffic light indicator is used to create data quality dashboards. Moreover, it is incorporated into Blindata Business Glossary and Data Catalog. In addition to dashboarding, the traffic light indicator is also used for notifying users about data quality results.


